Category Focus/categories/data-analysis
Data Analysis AI Tools
Discover and compare the best data analysis AI tools and software. Browse 66+ curated tools with reviews and rankings.
Projects tracked
66
Sort mode
RECENT
Page
1
Discover and compare the best data analysis AI tools and software. Browse 66+ curated tools with reviews and rankings.
Projects tracked
66
Sort mode
RECENT
Page
1
Alkera is an agentic data platform that brings data engineering, analysis, and science into collaborative multiplayer workspaces for humans and agents. Its open-source offering, Databench by Alkera, is described as the multiplayer workspace for data science, analytics, and engineering, where teammates and agents collaborate live inside notebooks and chats. The platform is built so that users can run any cell or agent on their laptop, another computer, or a GPU node, and can launch many agents in parallel to explore ideas. Every result traces back to the data and code behind it, so the people working in a workspace can follow a number straight to its source. Alkera is aimed at data teams that want one agentic platform to cover their entire data stack, rather than moving between disconnected tools. The context Alkera addresses is a data stack where engineering, analysis, and science are the daily work of the same team, and where agents are increasingly part of that work. Alkera's positioning is to bring those disciplines together in one place: the site promises "One agentic platform. Your entire data stack." and describes data engineering, analysis, and science happening in collaborative multiplayer workspaces for humans and agents. The promotional copy for the platform frames the outcome as "bringing confidence and speed to your agentic data stack." That combination — confidence and speed — is reflected in two of the platform's stated properties: results that trace back to the data and code behind them, and the ability to run many agents in parallel rather than one at a time. Alkera also emphasizes that it works with the applications and tools teams already use, so the platform is intended to sit alongside an existing stack instead of replacing it. Collaboration is the core of the workspace. Alkera supports multiplayer notebooks and chats in which humans and agents work side by side in the same session. The company's demo shows this directly: a user named Priya asks a signals agent to chart monthly revenue by segment for the year; the agent uses notebook tools, runs the notebook file q3-revenue.alknb.py across three cells, reports that enterprise is growing fastest at roughly 5% a month and drives most of the year's growth, and the run is marked finished. Marcus then joins the same conversation and asks to split the chart by region as well. The dbt agent responds by adding a region facet to the trend chart and editing a single cell in the same q3-revenue.alknb.py notebook. Because everyone is in the same workspace, these exchanges happen live: questions, agent actions, notebook edits, and results all appear in the same thread. Notebooks and dashboards are documented as first-class features, with a feature page dedicated to them. Agents in Alkera are not limited to a single machine or a single thread of work. The Product Hunt description states that users can run any cell or agent on their laptop, on another computer, or on a GPU node, and can launch many agents in parallel to explore ideas. That flexibility matters because different pieces of data work need very different compute: a quick chart can run locally, while a large model training run needs accelerators. The website illustrates this with a pretraining example that shows an FSDP-wrapped Llama model on 8x NVIDIA B200 hardware, with a loss curve charting training progress against tokens. In the interface, agents are presented with a model and behavior configuration: the demo shows Claude Opus selected, alongside settings labeled "High" and "Ask first," with the agent's activity counted as it uses tools (for example, "Used 2 notebook tools"). Agents also work with a charting API: the demo code calls alkera.chart(revenue).line with parameters for the x axis, the summed y value, a color split by segment, a title, a tooltip, and a facet, producing a monthly revenue by segment chart with Enterprise, Mid-market, and SMB series. Traceability is a stated property of the platform: every result traces back to the data and code behind it. Alkera extends this idea in several documented ways. Column-level lineage is shown across warehouse, transformation, and analysis layers, so a field can be followed from where it is stored, through the transformation that shapes it, to the analysis that consumes it. The platform also includes a knowledge base in which each knowledge entry shows its sources and whether it is human-verified — a visible signal of provenance for the information agents and people rely on. For changes, Alkera provides sandbox environments so modifications can be tested safely before they touch production, illustrated by a self-healing pipeline demo with a page for reviewing occurrences. Together these features give the workspace a record of where numbers come from, what depends on what, and what has been checked by a person. Alkera is organized as one platform that connects to the rest of a data stack through plugins and connections. The site states that Alkera works with the applications and tools you already use, and lists connectors spanning orchestration (Airflow), transformation (dbt), analytics databases (ClickHouse, DuckDB), lakehouse (Databricks), data warehouses (Snowflake, BigQuery, Redshift), query engines (Trino), databases (PostgreSQL, MySQL, SQLite, and generic SQL), object storage (AWS S3), data ingestion (Fivetran), business intelligence (Tableau, Looker, Sigma), data analysis (Hex), observability (Datadog), code and CI/CD (GitHub), communication (Slack), issue tracking (Linear), and knowledge sources (Google Docs, Confluence, Notion). A dedicated documentation page covers available plugins. On top of those connections, the workspace supplies notebooks, dashboards, chats, agents, knowledge entries, lineage, and sandboxes. Databench, the open-source workspace, can also be hosted by the user rather than used as a hosted service. The benefits Alkera claims are confidence and speed in an agentic data stack. Confidence comes from traceability and verification: results link back to the data and code that produced them, lineage runs down to the column level, and knowledge entries indicate their sources and whether a human has verified them. Speed comes from working with agents inside the same workspace where people already collaborate: an agent can run notebook cells, produce a chart, or edit a single cell in response to a teammate's follow-up question, and a user can fan out many agents in parallel instead of waiting on one. Running cells and agents on a laptop, another computer, or a GPU node lets teams match compute to the job, and sandbox environments let them test changes safely before they go live. All of this happens in a single workspace shared by humans and agents, so the work itself stays in one place. Several concrete scenarios appear in the material. In an analytics workflow, a user asks an agent to chart monthly revenue by segment for the year; the agent runs a .alknb.py notebook, returns the chart and a short read on growth, and a second teammate asks for a regional breakdown, which the agent adds as a facet to the same chart. In a data engineering workflow, changes are tested safely in sandbox environments before being applied, and column-level lineage shows how a field moves through warehouse, transformation, and analysis, which supports understanding impact. In an engineering and research workflow, a pretraining run is executed on 8x NVIDIA B200 GPUs with a loss curve tracking progress against tokens, using code and a run display that appear alongside the rest of the workspace. In a knowledge workflow, entries capture information with their sources and human verification status. Across all of them, the same thread of notebooks, chats, and agent actions carries the work forward. Alkera is built for data teams: data scientists, analysts, and data engineers, plus the agents that work alongside them. Its connector list indicates the surrounding stack such teams already use, from Airflow and dbt to Snowflake, BigQuery, Databricks, Tableau, Looker, and Slack. The public materials mention a generous free tier and a "Start for free" call to action, along with the option to book a demo with the founders. Databench, the open-source workspace, is available on GitHub for self-hosting. Alkera also publishes documentation for its foundations and plugins, provides security, privacy policy, and terms of service pages, and can be contacted at contact@alkera.ai. Because the open-source workspace and the hosted platform are described together, teams can choose to adopt the hosted experience or run the workspace themselves. Alkera's primary value proposition is a single agentic platform for the whole data stack: data engineering, analysis, and science performed in collaborative multiplayer workspaces where humans and agents work together. It combines parallel agent execution, flexible compute from laptop to GPU node, full traceability from result back to data and code, column-level lineage, verified knowledge entries, and safe sandbox testing, while connecting to the tools teams already use. For data teams that want to move quickly with agents without losing confidence in what those agents produce, Alkera is designed to keep the work — and the evidence behind it — in one shared place.
Pheebs is an open-source AI telemetry tool created by Eversynced that measures how engineers and teams actually work with AI coding agents. It sits quietly inside Claude Code, Cursor, and Codex via hooks, capturing lightweight interaction signals: the shape of the session, not its contents. The people it is built for are the ones who need an honest proficiency read rather than a guess — engineering leaders, platform teams, and the developers themselves. Its purpose is measurement: turning the ordinary activity of agent sessions into signals about model choice, verification habits, context management, orchestration, and the dollars that model choices are costing. The problem Pheebs addresses is a visibility gap that opens up precisely when a team starts moving fast. AI coding agents arrive, adoption climbs, and nobody can say what changed. Six observations illustrate the questions the tool was built to answer: model spend that buys nothing, such as a bigger model than the work needed; where AI code ships unchallenged; whether AI output gets verified at all; rework hiding inside the speedup, where follow-up prompts are fixing something the AI broke; and whether the enablement investment landed — for example, a review skill used weekly by 78% of engineers while a migration skill never caught on. The final observation frames the stakes: nobody on the team runs tests inside the agent loop, which is a missing harness rather than a skills gap. Distinguishing a structural gap from a coaching gap is the core problem Pheebs exists to solve. Pheebs captures data by hooking into the agents themselves. It works with three coding agents — Claude Code, Cursor, and Codex — and records seventeen event types that run from session_started through to artifact_found. Hooks fire on session starts and ends, prompt submissions, skill and slash-command expansions, sub-agent spawns, tool calls and failures, compaction, and background tasks. Typical recorded fields are deliberately small: a session_started event carries a codebase such as acme/checkout and a model such as opus; a prompt_submitted event carries a character count and, when the prompt intent classifier is enabled, an intent label such as task or debug; a tool_use_completed event carries the tool name and its duration, with recognized commands summarized as a tool_intent such as test_run. Claude Code and Codex additionally export native OpenTelemetry metrics and logs through the Pheebs proxy, while Cursor is covered by hooks alone. The design constraint behind all of this is that Pheebs captures interaction patterns, not content. It never records source code or file contents. It never records file paths or directory structures — a repo is reduced to org/repo from the git remote. It never records prompt text; a prompt becomes a character count. It never records raw command strings, since a command like npm test is read in process and recorded as tool_intent: test_run. It never stores your name or your email: the developer is the id behind your Pheebs token, stamped by the backend, or a truncated hash of your git email when no token is set, and your GitHub handle is never looked up. The only route in the backend contract that receives raw text at all is POST /classify-prompt, which takes one prompt in and returns one label out. The backend contract also includes POST /ingest for one event envelope per request, POST /validate-token to resolve a token to an identity and its consent flags, POST /otel/v1/{signal} as an OTLP passthrough so no observability credential ever ships in the client, and an optional GET /insights for what one developer can see about their own work. On top of those signals sits a documented proficiency model. It assesses six competencies: Models, covering model choice, effort settings, plan mode, and autonomy modes; Artifacts, the reusable configuration that shapes the agent, such as skills, sub-agents, slash commands, and context files; MCP, live connections to external systems like tickets, databases, browsers, and documentation; Evals, verification wired into the agent loop through tests, typecheck, lint, build, and review passes; Context management, deliberate use of the context window including compaction and the save, resume, clear lifecycle; and Orchestration, running more than one agent at a time via sub-agents, parallel work, worktrees, hooks, and plugins. Each practice is classified as Unobserved, Adopted, or Recurring — Recurring meaning it showed up in at least 3 of the last 4 active weeks — and the coverage index summarizes, per engineer, the share of applicable practices at Recurring. Five judgement signals sit alongside the competency model. On the output side, verification coverage measures the share of AI edits followed by a verification action such as a test run, typecheck, lint, build, or a check against a spec; pushback rate measures how often the engineer challenges AI output instead of accepting it; the refinement-to-repair ratio separates follow-up prompts that refine intent from those that repair breakage; and wholesale-accept rate captures sessions with no pushback, no repair, and no verification, weighted by lines changed — described as the composite red flag of polished output with no questions asked. On the input side, model-fit rate measures the share of sessions whose model class matched the size of the work. Pheebs follows three stated principles here: tasks are sized, so every task prompt gets a scope from a one-file change to open-ended design and a session is judged on its hardest prompt; misses count both ways, because an over-provisioned session burns budget silently while an under-powered one shows up as repair prompts; and Pheebs is an audit, not a router — it never intercepts a prompt or switches a model on anyone's behalf, it reads the gap and prices it, and the decision stays yours. The overall pipeline has five steps. A hook fires. Lightweight fields are extracted — event type, durations, counts, models, trigger types — with prompt text reduced to a character count and an optional intent label. Identity and repo are resolved from the Pheebs token or a truncated git email hash, and from org/repo on the git remote. Every event is logged locally in a JSONL log, and with a token set it is also sent to the backend. OpenTelemetry rides along for Claude Code and Codex. Sending requires both settings to be present: pheebs config set base-url and pheebs config set token. Both need to be set or nothing is posted, and unsetting either one stops sending — the local JSONL stays the durable copy either way. Pheebs also states there are four routes to any backend: self-hosted, or managed by Eversynced. Two deployment shapes are described. In the self-hosted model you run the backend and hold the data: telemetry goes from developers' machines to your infrastructure and Eversynced never sees it. That option includes the full client for all three agents under Apache-2.0, a documented contract and a reference backend in the repo, raw JSONL you can query with whatever you already use, and no account, no key, and no requests. In the managed model, the same open-source client points at a backend Eversynced operates, with the proficiency model rendered as reports and dashboards — the AI Enablement Assessment, a 30-day telemetry sprint ending in an executive debrief and a plan for the gaps. The benefits the content states are visibility rather than surveillance: knowing which models are in play, whether AI output gets verified, whether enablement investments landed, and what the model-fit gap costs. The reporting built on top includes a practice adoption funnel, with one bar per competency split by how many engineers have not acted on it, acted on it once, or acted on it week after week; a practice heatmap putting every engineer against every competency, where a cold column means the team is missing the setup and practice for it and a cold row calls for coaching; a per-engineer view showing how much of each competency has become habit; and a signals table showing the five judgement signals per engineer against a team median. The dollar view prices the gap: in the illustrative example, a savings opportunity of $9,960 against $32,400 of list-price spend, described as 31% and an API list-price equivalent estimated upper bound, with models used and work as sized split across Frontier, Large, Medium, and Small classes. Decisions and figures come from complete sessions only, with coverage reported as complete, incomplete, no telemetry, and unpriced. The quickstart is three commands: npm install -g pheebs, pheebs init for interactive setup across all three agents, and pheebs doctor to check the wiring. Eversynced states that every Eversynced engineer is instrumented with Pheebs; it powers the measurement layer of their AI delivery framework, and the reporting built on top of it ships with the AI Enablement Assessment run for client teams. The product is therefore aimed at teams adopting AI coding agents who want evidence about how those agents are actually being used in their codebase. In short, Pheebs turns the day-to-day shape of AI coding sessions — model choices, prompts reduced to counts, tool calls, verification, compaction, and orchestration — into an honest, legible read on proficiency, adoption, and cost, while keeping the code, the prompts, and the identity of the developer out of the dataset.
Monospace from Directus is a governed API layer positioned between enterprise data and everyone who builds on it. Its core promise is captured in two lines from the product itself: it is the governed API layer for every app, person, and agent, and it brings all your data into one space. The product lets you connect any data source, after which your developers, business teams, and AI agents receive live, read-write access to that data. Critically, this access is delivered without copying or moving any of the underlying data, so the systems of record stay exactly where they are while the people and tools that need them gain a single, governed way in. The problem Monospace addresses is rooted in legacy infrastructure. As the product explains, your oldest databases were not built with AI or modern applications in mind. Those systems hold valuable data, but they were designed for a different era of software and a different set of consumers. Exposing them to contemporary applications, to business users who want self-service access, or to AI agents that expect programmatic, read-write interaction has traditionally meant rebuilding, migrating, or duplicating those databases. Monospace avoids that entire class of work by generating interfaces directly from the databases as they are. That approach matters because it preserves existing investments in data infrastructure while unlocking the data for modern consumers. The first capability is broad connectivity. Monospace connects to any data source, which means the value of the product is not limited to a single database technology or a single vendor's ecosystem. Rather than forcing organizations to standardize or migrate before they can build on their data, Monospace meets the data where it already lives. This is useful because real enterprises run on a patchwork of systems accumulated over years or decades, and the cost of consolidating them is often prohibitive. By accepting any data source as a starting point, Monospace lowers the barrier to giving modern applications, teams, and agents access to data that would otherwise remain locked inside the systems that hold it. The second capability is live, read-write access. Once a data source is connected, the people and tools that build on it are not limited to read-only reporting or exports. Developers, business teams, and AI agents all get read-write access to the connected data. Read-write access is what makes the layer useful for real workloads rather than just observation: applications can create and update records, business teams can work with data directly, and AI agents can act on the data rather than merely describe it. The emphasis on live access reinforces that Monospace is not a snapshot or a sync engine; it reflects the state of the underlying data source as it changes. The third capability is the governance layer itself. All of these consumers — developers, business teams, and AI agents — operate under the same granular permissions model. That single model is what makes Monospace a governed API layer rather than simply an access layer. Granular permissions mean access can be scoped precisely to what each consumer needs, and because every consumer class is governed by the same model, organizations do not have to maintain separate access regimes for their human users and their automated agents. Combined with the fact that no data is copied or moved, this means governance is applied at the point of access rather than through duplicated datasets that each carry their own risk of drift, staleness, and inconsistent permissions. Monospace's distinctive approach is real-time introspection. Instead of requiring a data model to be redefined, exported, or rebuilt in a new system, Monospace generates interfaces directly from existing databases, as they are. It does this by introspecting the schema and queries in real time. In practical terms, that means the structure of the database — its tables, fields, relationships, and the queries used against it — is read by Monospace and used to produce the interface that developers, business teams, and AI agents then use. Because the introspection happens in real time, the generated interface stays aligned with the database rather than drifting from it as the schema evolves. This is the mechanism behind the product's central claim: your oldest databases do not need to be rebuilt, because Monospace generates the interface on top of them instead. The benefits follow directly from those capabilities. First, organizations avoid the cost, risk, and downtime of rebuilding legacy databases for modern applications or AI. Second, because no data is copied or moved, there is no duplicated dataset to keep in sync, and the system of record remains the single source of truth. Third, a single granular permissions model simplifies governance across every class of consumer — human and automated alike. Fourth, the combination of connecting any data source with live read-write access means the data an organization already owns becomes immediately usable by the applications, teams, and agents that need it, rather than being trapped behind a migration project. Together these outcomes turn existing, sometimes aging data infrastructure into a foundation that modern consumers can build on. Concrete scenarios follow from how the product describes itself. One is giving AI agents live, read-write access to enterprise data: rather than working from copies or stale extracts, an agent can operate against the real data under the same permissions model as everyone else. Another is enabling business teams to work directly with data that lives in systems they would otherwise need engineering help to reach, with granular permissions keeping that access appropriately scoped. A third is equipping developers to build modern applications on top of databases that were never designed for them, without a rebuild, generating interfaces straight from the existing schema and queries. A fourth is unifying access across multiple data sources: because Monospace connects any data source, organizations that run several systems can expose them through one governed layer, in one space, rather than building a separate integration for each. Monospace is explicitly built for three audiences: developers, business teams, and AI agents. The mention of enterprise data and of governance indicates the product is aimed at organizations, and it comes from Directus, an established name in data and developer tooling. Its positioning as an API layer confirms that it is consumed programmatically. The website lists no pricing tiers in the available content, and no technology stack or integration list is stated, so those details should be confirmed directly with the vendor. What is stated is the shape of the product: an API layer, governed, connecting any data source, serving developers, business teams, and agents alike. Monospace from Directus takes a clear position on a common enterprise problem: the data you already have should be usable by the apps, people, and agents of today without being rebuilt for them. By sitting between enterprise data and everyone who builds on it, connecting any data source, granting live read-write access under one granular permissions model, and generating interfaces by introspecting schemas and queries in real time — all without copying or moving data — Monospace turns existing databases into a governed foundation for modern development, self-service access, and AI. All your data. One space.
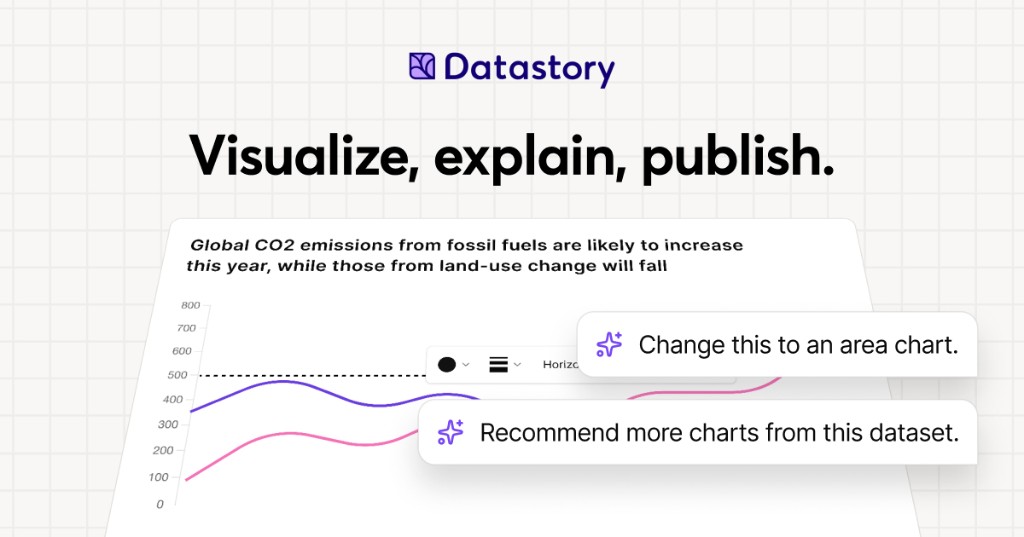
Datastory is a no-code platform for data storytellers. It is built for people who want to turn the world's data into stories worth sharing, whether that data comes from their own spreadsheets or from a curated catalog of open datasets. With Datastory you can upload your own data or search the catalog, let AI suggest the charts, and publish in minutes. The platform brings together a visualization Studio, a CMS, AI assistance, and access to more than 2,000 open datasets, so that interactive charts, websites, and reports can be created in one place. Its stated purpose is to take users from raw, messy data all the way to a published narrative, producing charts that tell a story instead of just showing stats. Datastory positions itself against the limits of conventional charting tools. Its website states that most tools stop at the visual, while Datastory does not, describing itself as the only platform that takes you from raw, messy data all the way to a published narrative. That framing reflects a common workflow problem for anyone working with data: finding trustworthy source material, understanding what the columns in a table actually represent, choosing a chart type that fits the shape of the data, writing accurate captions with sources attached, and then distributing the result in a format that works across channels. Datastory addresses each of these steps inside a single no-code environment, rather than asking users to stitch together a spreadsheet, a charting library, a design tool, and a CMS. For organizations that publish statistics, the platform is intended to close the gap between having data and communicating it clearly to an audience. The visualization layer is built around a diverse gallery of chart types with interactivity and responsive design out of the box. Datastory lists bars, lines, areas, beeswarms, slopes, treemaps, scatter plots and more, describing them as every common data visualization, ready to use. Users can switch chart types without re-binding data, so a single table can be expressed as one chart and then re-expressed as another without rebuilding the underlying dataset. The chart picker is smart: it looks at the columns in your data and proposes the right encoding, whether the data is categorical, temporal, geographic, or hierarchical, and chart-type suggestions are driven by the shape of the data itself. The stated goal is to go from table to polished data visualization in minutes: pick a table, pick a chart, ship it, or start from one of the editorial templates and tweak. Every chart is responsive and can be embedded anywhere, and users can add inline annotations, sources, and methodology, then customize to their own brand or pick from journalism presets. Datastory AI is presented as AI that actually understands your data. You can ask AI to recommend interesting angles or come with a specific question and get an answer grounded in your tables, with a chart to match. The AI ships with your CSV file, linked data, or Datastory's Open Data Catalog as context: it reads your tables, understands your dimensions, picks the right chart, and writes the caption with sources attached, while the user stays in the driver's seat. The platform emphasizes that auto-captions come as editable drafts and that AI can only provide insights grounded in data that exists in your workspace, so there are no data hallucinations and never a hallucinated stat. Compose with AI lets users build whole stories from a prompt, such as visualizing Swedish housing prices by region since 2010, and the insight finder surfaces anomalies, trend changes, and correlations across thousands of rows in seconds. More broadly, AI-powered insights are described as revealing hidden patterns, unexpected correlations, and key drivers within datasets, turning raw information into actionable intelligence. The Open Data catalog lets users find, explain, and visualize statistics from quality data sources, browsing datasets from vetted sources such as the OECD, WHO, and Eurostat. Powerful browsing by topic, source, or trending helps users find exactly what they need, and a country filter makes it easy to find data that their own country has reported on. The catalog is intended to help users quickly find reliable data for a project or to enrich an organization's own data by adding a global perspective that nuances local or industry-specific figures. Examples highlighted on the site include Women in parliament worldwide and Population trends in Europe, both from the World Bank, plus sample CSVs such as the world's largest cities ranked from Wikidata and Sweden's most common surnames from SCB. Users can also supercharge an analysis by connecting their own data with open data sources to tell a more complete story. The Datastory workflow is described as a four-step path from connection to publication. Step one is Connect data: pull data from spreadsheets, your own linked data, or quality metrics from the Open Data Catalog. Step two is Shape your story: collaborate with AI to identify the most interesting insights and the best way to visualize them. Step three is Refine details: edit captions, add annotations, and tweak colors to make the story pop, either by asking AI or by tweaking manually. Step four is Publish: release the result as a standalone link, embed it in websites, or export it as a high-quality image, ready for any channel. This sequence is the core of the platform's differentiation, since it deliberately extends past visualization into narrative creation and distribution. Publishing and distribution are handled through an anywhere-embed approach. Users can drop a chart into Notion, Webflow, a newsletter, or a CMS, using a responsive iframe with shareable URLs and OG previews baked in. Charts are responsive and can be embedded anywhere, and the final output can also be published as a standalone link or exported as a high-quality image. Because the same chart can be embedded in multiple destinations while keeping shareable URLs and preview metadata, the platform is designed for teams that need their visuals to travel across websites, documentation, and social channels without rework. The outcome Datastory emphasizes is the ability to inform, engage, and drive action with compelling visualizations. Organizations that use it describe making their work more accessible and more effective. Tax Justice Network says Datastory has more than lived up to its expectations and that the team was a delight to work with, adding that it is thrilled about the Policy Tracker Datastory developed and looks forward to sharing it publicly. AI Sweden describes Datastory as knowledgeable, flexible, and fast as a supplier, and values the creative dialogue and the ideas that made the end result better than hoped for. Swedish House of Finance says that with Datastory's help it was able to make its research accessible to a much wider audience, crediting enthusiasm for research communication and knowledgeable staff for a very successful collaboration. Concrete use cases on the site include visualizing municipality data, where Datastory built an interactive map application for AI Sweden using its advanced charting library and data management system, producing the Kommunkartan map of AI initiatives across Swedish municipalities with bar charts, filters, and zoom controls. Other described scenarios include building a policy tracker for an advocacy organization, making academic research legible to a wider audience, embedding a chart into a Notion page, Webflow site, newsletter, or CMS, and enriching an organization's internal data with open datasets to add a global perspective. The platform's sample content, such as GDP per capita rankings and population trends, illustrates how published charts are meant to be shared directly with readers. Datastory is aimed at data journalists, researchers, and analysts, a group the site names explicitly while inviting them to create compelling visualizations that inform, engage, and drive action. It is also used by larger organizations; the site lists United Nations Department of Economic and Social Affairs, AI Sweden, Tax Justice Network, the International Federation of Red Cross and Red Crescent Societies, Swedish House of Finance, Swedish Television, Dagens Nyheter, and Internet Foundation in Sweden among the organizations that trust it. Beyond the self-serve platform, Datastory Enterprise offers to design and build impactful data products with Datastory's award-winning team, covering strategy, custom applications, data integration, and training, all powered by the Datastory platform, with an invitation to contact the team for details. The summary takeaway is straightforward: Datastory is a no-code environment where open data, your own data, and grounded AI come together to produce interactive charts, websites, and reports that can be published and embedded in minutes. Its distinguishing claim is that it carries a project the full distance from messy raw data to a shareable, sourced narrative, rather than stopping at the chart.
FixMyFX is a free, no-sign-up calculator for founders who sell or spend in foreign currencies. It lets you enter your annual revenue and annual expenses, and shows roughly what FX fees are costing you per year, followed by a plain-English plan to minimise those costs. The recommended approach is to receive and spend in the same currency, for example by using Wise or Airwallex alongside a local bank account. Where most FX tools compare transfer rates, FixMyFX looks at your whole flow — both income and spending — and the tool runs entirely in your browser, so your numbers are never collected or sent to a server. The problem FixMyFX addresses is what the site calls the "Lazy Tax." Most founders get charged FX fees twice: once on income and once on expenses, which can quietly drain a meaningful share of revenue. The calculator's framing notes that most founders lose 2-5% of revenue to hidden FX fees. FixMyFX is designed for companies that sell to customers abroad, pay suppliers abroad, or both; the site states plainly that if your company, clients and suppliers are all in the same country, you probably don't need this tool. Because the loss is spread across payment processing and bank spreads rather than appearing as a single line item, it is easy to overlook until it is quantified in annual terms. The calculator itself is built around a short set of inputs. You first select where your company is registered, choosing from United Kingdom (GBP), United States (USD), Eurozone (EUR), Australia (AUD), Canada (CAD), the Nordics (DKK/NOK/SEK), New Zealand (NZD), Singapore (SGD), or Other (USD). You then describe how you manage currency: either a Single Currency setup, where you use your local bank for everything in a standard arrangement, or a Multi Currency setup, where you hold funds in multi-currency accounts in an FX-optimised arrangement. Finally you enter your annual revenue and annual expenses in your home currency, along with the percentage of each that is in a foreign currency — for example 60% of revenue or 40% of expenses, with expenses such as SaaS tools, ads and hosting paid in USD given as a typical example. FixMyFX then estimates your fees under two scenarios. The "Current setup" — labelled the Lazy Tax — combines Stripe auto-convert with bank FX. The calculator explains its assumptions inline: Stripe auto-conversion costs 1% (US) or 2% (UK/EU/Rest) on inbound foreign revenue, and a typical bank FX markup of around 3% is applied as a spread on foreign spending and subscriptions. The "FixMyFX setup," labelled Zero Leak, assumes a multi-currency account instead. Direct payout to a matching multi-currency bank account carries a 0% fee; direct spend from matching currency balances also carries a 0% fee; and only the net profit transferred home is converted, at roughly a 0.4% fee using the interbank rate. Both estimates are broken down in the interface under a "How is this calculated?" disclosure so you can see where the numbers come from. The headline output is the Potential Annual Savings, calculated over a 12-month period and framed as money that goes back into your business every year. FixMyFX translates the figure into tangible equivalents so it is easier to grasp — MacBooks Pro, months of Claude Max 20x, Claude Max 5x and Claude Pro subscriptions, and fancy coffees. There is also a toggle to include your savings amount when sharing, and one-click sharing to Twitter/X and LinkedIn, with prefilled text noting that most founders lose 2-5% of revenue to hidden FX fees. If your inputs show you are already operating efficiently, the tool shows a "You are winning!" state instead, explaining that you don't auto-convert revenue (saving 1-2%) and that paying expenses directly from foreign currency balances stops the FX leak completely; in that case it assumes you pay roughly 0.4% conversion fee only on the net profit you bring home. Beyond the number, FixMyFX provides a plain-English, four-step plan for achieving the savings. Step one is to open a multi-currency account, with Wise Business or Airwallex given as examples, matching the currencies your customers pay in (EUR/GBP/USD). Step two is to connect those local bank accounts to Stripe so payouts land directly, avoiding Stripe's 1-2% auto-conversion markup. Step three is to pay foreign expenses — SaaS, ads, overseas contractors — directly from those currency balances with zero FX spread. Step four is to convert only what is left back to your home currency at transparent ~0.4% interbank rates. The four steps are shown alongside the savings estimate and can be expanded in place. A defining characteristic of FixMyFX is that the calculation runs entirely in your browser. The site states that none of your numbers are collected, sent to a server, or tracked, and that no sign-up is required. That makes it practical to enter real revenue and expense figures without worrying about where the data goes. The tool is explicitly presented as an estimator: it provides estimates based on standard publicly available fee structures, does not constitute financial advice, and advises checking your own bank's PDS. The outcome FixMyFX is designed to produce is straightforward: stop the FX leak and keep more of your revenue. By quantifying the annual cost of auto-conversion and bank spreads, it turns an invisible overhead into a specific number you can act on. The estimated savings figure is presented as money that returns to the business each year, and the accompanying plan gives concrete steps rather than general advice. For founders already running a multi-currency setup, the tool provides confirmation that their arrangement is efficient, along with an explanation of why. Practical scenarios include a UK-registered SaaS company billing customers in USD and EUR through Stripe, which can enter its revenue mix to see what auto-conversion is costing. Another is a founder paying for SaaS tools, ads and hosting in USD while earning in GBP, who can model the bank spread on those subscriptions. Founders weighing whether to open a Wise Business or Airwallex account can use it to size the opportunity first. Teams already holding multi-currency balances can run the numbers to confirm they are winning. And founders who want to share the result can post a prefilled message to Twitter/X or LinkedIn with or without their savings amount. FixMyFX is aimed at founders of companies that sell or spend in foreign currencies — particularly those registered in the UK, US, Eurozone, Australia, Canada, the Nordics, New Zealand or Singapore, with an "Other (USD)" option for everywhere else. It is free to use, requires no sign-up, and runs on the web. It was built by Tania Bell, described as a product manager who can code and a former finance manager. The site also offers an optional way to support the builder through a "buy me a coffee" gratuity in USD, GBP or EUR at preset amounts ($5, $15, $25) or a custom amount, explicitly framed as a non-refundable voluntary gratuity rather than a purchase of goods or services. In short, FixMyFX is a free browser-based calculator that shows founders what foreign exchange fees are costing them across both income and expenses, then hands them a clear four-step plan — open matching multi-currency accounts, connect them to Stripe, pay foreign bills directly, and convert only the remainder — to keep that money in the business instead. It is a diagnostic and an action plan on one page, with no sign-up and no data leaving your browser.
OpenScience is an open-source AI workbench for scientific research, described by its creators as an open-source AI co-scientist. It provides one workspace for literature, code, experiments, compute, and results, replacing the usual scatter of tools a researcher juggles during a project. The agent reads papers, writes code, and runs experiments alongside the user, working inside notebooks and a terminal rather than in a single chat window. It is model agnostic: free models are included, and users can bring Claude, GPT, Gemini, or any other provider. OpenScience is free and open source, and it is backed by Synthetic Sciences and Y Combinator. Scientific research work is fragmented by nature. A single question can require reading a stack of papers, locating measurements in a public database, writing scripts to analyze a structure, running those scripts somewhere with enough compute, and then plotting and interpreting the output. Each of those steps lives in a different tool, and long-running jobs in particular tend to break the flow of an investigation. General-purpose AI assistants help with pieces of that work but were not built around the scientific stack: they do not natively treat databases such as UniProt or PDB as tools, they do not schedule jobs onto a Slurm or PBS cluster, and their performance can vary depending on which model or provider route a request happens to take. OpenScience is positioned against exactly that problem, offering one workspace that spans literature, code, experiments, compute, and results, plus a set of models the team has tested and benchmarked specifically for scientific agents so that behaviour stays consistent across routes. At the core is an agent that reads papers, writes code, and runs experiments with the user. It operates in notebooks and in a terminal, which matters because scientific work rarely fits inside a chat interface: notebooks are where analysis lives, and the terminal is where environments, scripts, and job submission live. The agent can execute the code it writes and return concrete artefacts rather than suggestions. In the example published on the site, it loads a research-lookup skill, searches two sources, reads a file, runs a Python script against a PDB structure, and produces a 1200 by 900 PNG plot comparing predicted and measured values. The interface shows Copy, Undo, and Fork controls along with an Explore agent, so a researcher can branch a line of work, revert it, or run investigation threads in parallel without starting over. OpenScience is model agnostic. Free models are included, and users can supply their own keys for any provider, including Claude, GPT, and Gemini. One option described on the site is using 30+ models through a single wallet, which removes the need to maintain separate provider accounts. Users who already pay for ChatGPT Plus or Pro can sign in with OpenAI and use the subscription they already have, and a local model can be run instead where that is preferred. For a curated route, Ace gives a handpicked set of models that OpenScience has tested and benchmarked for scientific agents, plus managed search and memory, all behind one Wallet. The stated aim is to avoid provider accounts and to avoid inconsistent performance across different routes. Scientific databases are exposed to the agent as tools rather than as something a user has to query manually. The site names UniProt, PDB, ChEMBL, PubChem, and arXiv, and says there are 37 more, putting more than forty data sources within reach of a single research session. Alongside those, OpenScience bundles 371 skills across biology, chemistry, physics, machine learning, and writing, with a curated research core. Skills act as prepared capabilities the agent loads when a task calls for them; in the published demo, the agent loads a research-lookup skill before it searches sources and reads files. The combination is useful because it lets the agent ground its reasoning in real measurements and structures, for example by scoring the same set of mutants that an external measurement set covers, rather than working only from what a language model happens to recall. Compute is managed rather than left to the user. OpenScience builds environments and scales on demand, and it can run work on a laptop, on a cluster, or on GPUs. Long jobs are sent to Modal, to the user's own servers, or to a Slurm/PBS cluster, so a researcher can keep working while an experiment runs elsewhere. Internally the agent spends time on tasks and decides what to do next, as the demo shows with a working timer and a short reasoning step before it searches and cross-checks data. For experiment-driven work, Autoresearch takes a metric as input, runs experiments, logs every one of them, and keeps hill-climbing, so an optimisation or parameter search can proceed without manual babysitting. Multi-session support lets several agents run in parallel on the same project, which suits investigations with separate threads of analysis or comparison. The overall approach is to put an agentic loop on top of a real scientific toolchain rather than a chat window. A session starts with a task description; the agent reasons about it, loads any skills it needs, consults databases and files, writes and runs code, and returns results with the artefacts attached. When a question calls for measurement, the agent finds the comparison set, scores the same mutants the same way, and plots predicted against measured values: the published example reports a correlation of r = 0.71 across n = 26 mutants and names the three substitutions that are stabilising under both prediction and measurement. Because the work happens in notebooks and a terminal with managed compute behind it, the same environment can carry a task from literature lookup through job execution to a finished figure. The team also publishes benchmark results to show where the agent stands: 75.7% on Terminal-Bench Science, 71.4% on Terminal-Bench 4.0 (science), 82.2 on BiomniBench-DA, and 47.3% pass@3 on OpenScience Bench, which measures end-to-end research. The stated benefit is a single workspace in which literature, code, experiments, compute, and results live together, so a researcher spends time on the question rather than on moving data between tools. Reading papers, writing code, and running experiments are handled by one agent that can also schedule the heavy jobs. Model choice becomes a configuration detail rather than a blocker: free models are available immediately, the user's own keys work for any provider, a ChatGPT Plus or Pro subscription can be reused, or a local model can be run. Because scientific databases are available as tools, answers can be checked against real records within the same session. And because experiments are logged and the Autoresearch loop keeps climbing toward a metric, iterative work retains a record of what was tried. On the team's own measurements, the agent leads every scientific benchmark they have run. Concrete scenarios appear throughout the site. The most fully described is a protein stability scan: the user asks which T4 lysozyme point mutants are predicted to be stabilising and asks for a comparison against ProTherm measurements. The agent identifies ProTherm as the comparison set, scores the same 26 mutants on the 2LZM structure, cross-checks the entries, and plots predicted against measured ΔΔG. The example also shows the follow-ups such a workflow implies, such as running the three candidates through FoldX for an independent estimate or drafting the methods paragraph with the ProTherm citation. Other stated uses include reading and searching literature, running code in notebooks and a terminal, sending long jobs to Modal, personal servers, or a Slurm/PBS cluster, running several agents in parallel on the same project, and using Autoresearch to iterate against a chosen metric with every experiment logged. OpenScience is aimed at researchers and scientists who write code as part of their work, across the fields its bundled skills cover: biology, chemistry, physics, machine learning, and writing. The project is backed by Synthetic Sciences and Y Combinator, and its Product Hunt topics are Open Source, Artificial Intelligence, and Science. Integrations named in the content include scientific databases such as UniProt, PDB, ChEMBL, PubChem, arXiv and 37 more; model providers such as Claude, GPT, and Gemini; OpenAI sign-in for ChatGPT Plus or Pro subscribers; local models; the Ace model catalogue; and compute targets including Modal, the user's own servers, and Slurm/PBS clusters. Installation is shown as a shell one-liner: curl -fsSL https://openscience.sh/install | bash. The software is free and open source with free models included, and documentation is published at openscience.sh/docs. OpenScience's value proposition is straightforward: an open-source, model-agnostic AI workbench that treats scientific research as a full workflow rather than a chat. It reads papers, writes and runs code, operates in notebooks and a terminal, reaches more than forty scientific databases as tools, brings 371 bundled skills, and manages compute from a laptop to a cluster or GPUs. Autoresearch turns a metric into a logged, iterative experiment loop, multi-session support allows parallel agents on one project, and free models or any provider, including Claude, GPT, Gemini, a ChatGPT subscription, or a local model, can drive it. The result, according to the team's benchmark reports, is an AI co-scientist that leads the scientific benchmarks they have run.
Inqueria is a next-generation qualitative research platform built around AI-moderated interviews. Instead of asking a researcher to write a discussion guide and sit through every conversation personally, Inqueria lets a team describe a research objective in plain English and then runs the interviews itself, following adaptive conversational paths with each participant. It is designed for people who need to understand why users behave the way they do — why they churn, why they choose an alternative, or where onboarding breaks down — and who need that understanding at a scale a single moderator cannot reach. The platform's stated promise is direct: run 50 deep interviews overnight rather than spending the month it takes to schedule five. Traditional qualitative research is slow and manual by nature. A human researcher runs one interview at a time, so studies queue behind calendars, participants have to be recruited and scheduled one by one, and weeks or months can pass before a single insight surfaces. Analysis is just as heavy, because transcripts have to be coded by hand before themes emerge. Surveys sit at the opposite extreme: fast and broad, but unable to probe a thin answer, chase an unexpected thread, or capture the hesitation behind a response. Inqueria is positioned in that gap. It offers the conversational depth of an interview without a scheduling queue, and it replaces manual transcript coding with one-click synthesis, so teams can start learning instead of waiting for a study window to open. The site frames the shift simply as: stop manual transcript coding, start learning. The first step is research design, which happens in minutes rather than days. A team member describes the research objective in plain English — for example, "Understand why new users churn within their first week, and what would have made them stay" — sets the audience such as recently churned users, and picks a tone such as warm and professional. Inqueria then generates a complete question plan, including a system prompt, follow-up probes and an ideal conversational flow, ready to share in under five minutes. The site lists average setup time at five minutes with instant AI generation, and the product emphasises that there is no scripting and no guesswork involved. Rather than writing a guide from scratch, the researcher reviews and works from the plan Inqueria produced from a single sentence of intent, such as an eight-question plan built from one churn objective. The second step is adaptive interviewing. Participants join through a secure link and speak directly with Inqueria. The AI moderator listens to each answer, probes deeper when a response is thin, and follows threads the researcher did not anticipate — behaviour the company describes as interviewing users the way a trained researcher would. No human moderator is involved in the conversation itself. The product demo shows a participant being asked, on question 3 of 8, to walk through the specific moment they realised onboarding was not working for their team, inside an anonymous session where they can type or speak their response. Crucially, these sessions run concurrently rather than in sequence. Inqueria advertises unlimited parallel capacity, meaning as many interviews as your plan allows can be conducted at the same time, with no calendar to fill and response limits that apply by plan. The third step turns those conversations into a research library. One click surfaces cross-session themes, sentiment and verbatim quotes, and then goes further: cross-study patterns, theme saturation and response-level engagement signals. The synthesis view shown on the site, drawn from 148 sessions, displays top themes with prevalence figures, a net sentiment score, an engagement signal noting that 23 respondents described setup as "fine" but hesitated and backtracked while explaining it, a compounding indicator showing a theme also appeared in three past studies, and a saturation marker showing the point at which themes stopped changing. Because every study adds to the research library, patterns surface across all of a team's work rather than being trapped inside a single project file. Themes stay evidence-linked: Inqueria traces each one back to the exact quote it came from and checks the theme against every transcript, showing you the participants who disagree. Privacy is built into the pipeline rather than bolted on afterwards. Inqueria performs automated PII redaction in-house, detecting and stripping names, emails, phone numbers, IDs and addresses before any data leaves the platform — the site illustrates a raw input such as "My name is John and I work at Apple" becoming "My name is [REDACTED] and I work at [REDACTED]". Because redaction happens before any model sees a transcript, sensitive details never reach the AI layer, and data-retention policies are configurable. On the methodology side, Inqueria does not treat every study identically. Describe an objective and it recommends the best-fit method from a rigorous toolkit, then tells you why it chose it, and you can override the choice at any time. The named methods include Jobs-to-be-Done, Laddering, Critical Incident, Journey, Evaluative, Phenomenological and Semi-structured. The site describes this as methodological rigor: the right method, chosen for you. Overall, the approach is adaptive, concurrent and evidence-linked. A study begins with an objective rather than a rigid script, runs as many simultaneous conversations as the plan allows instead of one at a time, and finishes in a synthesis layer that ties every theme to the quotes underneath it. Inqueria summarises its own output as conversational, cross-study and evidence-linked qualitative research, where the research library compounds with each new study rather than sitting as a folder of stale transcripts. Interviews adapt to every answer, and the analysis is checked against every transcript, so the themes are not just generated but validated against the raw material and traced back to the participants who produced them. The practical benefits follow from that structure. Setup takes under five minutes on average, so a study can be designed and shared the same day the question is asked. Because interviews run concurrently, a team can reach volumes that would be impossible for a human moderator working one session at a time — the site's framing is running 50 interviews overnight versus skipping the month it takes to schedule five. One-click thematic synthesis removes the manual coding stage, and because each theme carries its verbatim quotes and its prevalence figure, findings arrive with the evidence attached. Engagement signals flag responses where wording and delivery diverge, and saturation markers show when additional interviews stop adding new themes, which helps teams judge when they have heard enough. Privacy redaction lets organisations collect candid feedback without exposing participant identities, and the accumulating library means each study makes the next one more valuable. Inqueria lists strategic use cases across several kinds of qualitative discovery: Customer Discovery, Churn & Retention, Market Validation, Concept & Packaging, Brand Perception, Employee Experience, Academic Research, Community & Policy, and "something else entirely" for work outside those categories. Customer Discovery is described in the most detail: uncovering the jobs, triggers and switches behind why people choose you, or don't, with an example question such as "When did you first realise the alternatives weren't solving your problem?" The Churn & Retention category maps directly to the churn example used throughout the site, where recently churned users are interviewed about the moment the product stopped working for them and what would have made them stay. These categories describe the kinds of studies the platform is presented as built for. For target users, the site says Inqueria is used by top product teams at fast-growing startups, and its pricing tiers point to three further audiences. Research is aimed at freelance researchers and UX teams. Consultant is built for consulting teams sharing findings with clients, and adds a client read-only insights share link plus the ability to remove Inqueria branding from the participant page. Scale is for larger corporate teams and includes five team seats, while Enterprise covers unlimited interviews, studies and seats with SSO, security review and dedicated support. Pricing is presented as being based on outcomes rather than features. Explore is free, with no card needed, one active study, three interviews per month, the qualitative AI agent and 10 insight refreshes monthly. Research is $55 USD per month for 30 interviews with unused allowance rolling into the next month, 5 active studies, thematic synthesis and sentiment, 15 insight refreshes, Excel spreadsheet export and a custom AI interview persona. Consultant is $109 USD per month for 75 interviews, 10 active studies, 30 insight refreshes, the client share link and branding removal. Scale is $169 USD per month with 5 team seats, 150 interviews per month, unlimited active studies, 50 insight refreshes and personalised email distributions. Enterprise is custom, and a one-off study pack of 20 interviews is available for $35 USD with no expiry. GST is added at checkout for Australian customers, with AUD billing. In summary, Inqueria replaces the slow, manual loop of scheduling interviews and hand-coding transcripts with an AI-moderated research process that designs the study, runs every conversation concurrently along adaptive paths, redacts PII before any model sees the data, and synthesises themes that stay linked to the exact quotes behind them. Its primary value proposition is depth at scale: fifty interviews overnight, evidence-linked findings checked against every transcript, and a research library that gets more useful with each study.
Flan helps couples and young professionals see their financial future, not just past spending. Visual projection-first budgeting, shared goals, and life-event planning. Available on iOS and the web, coming soon to Android.
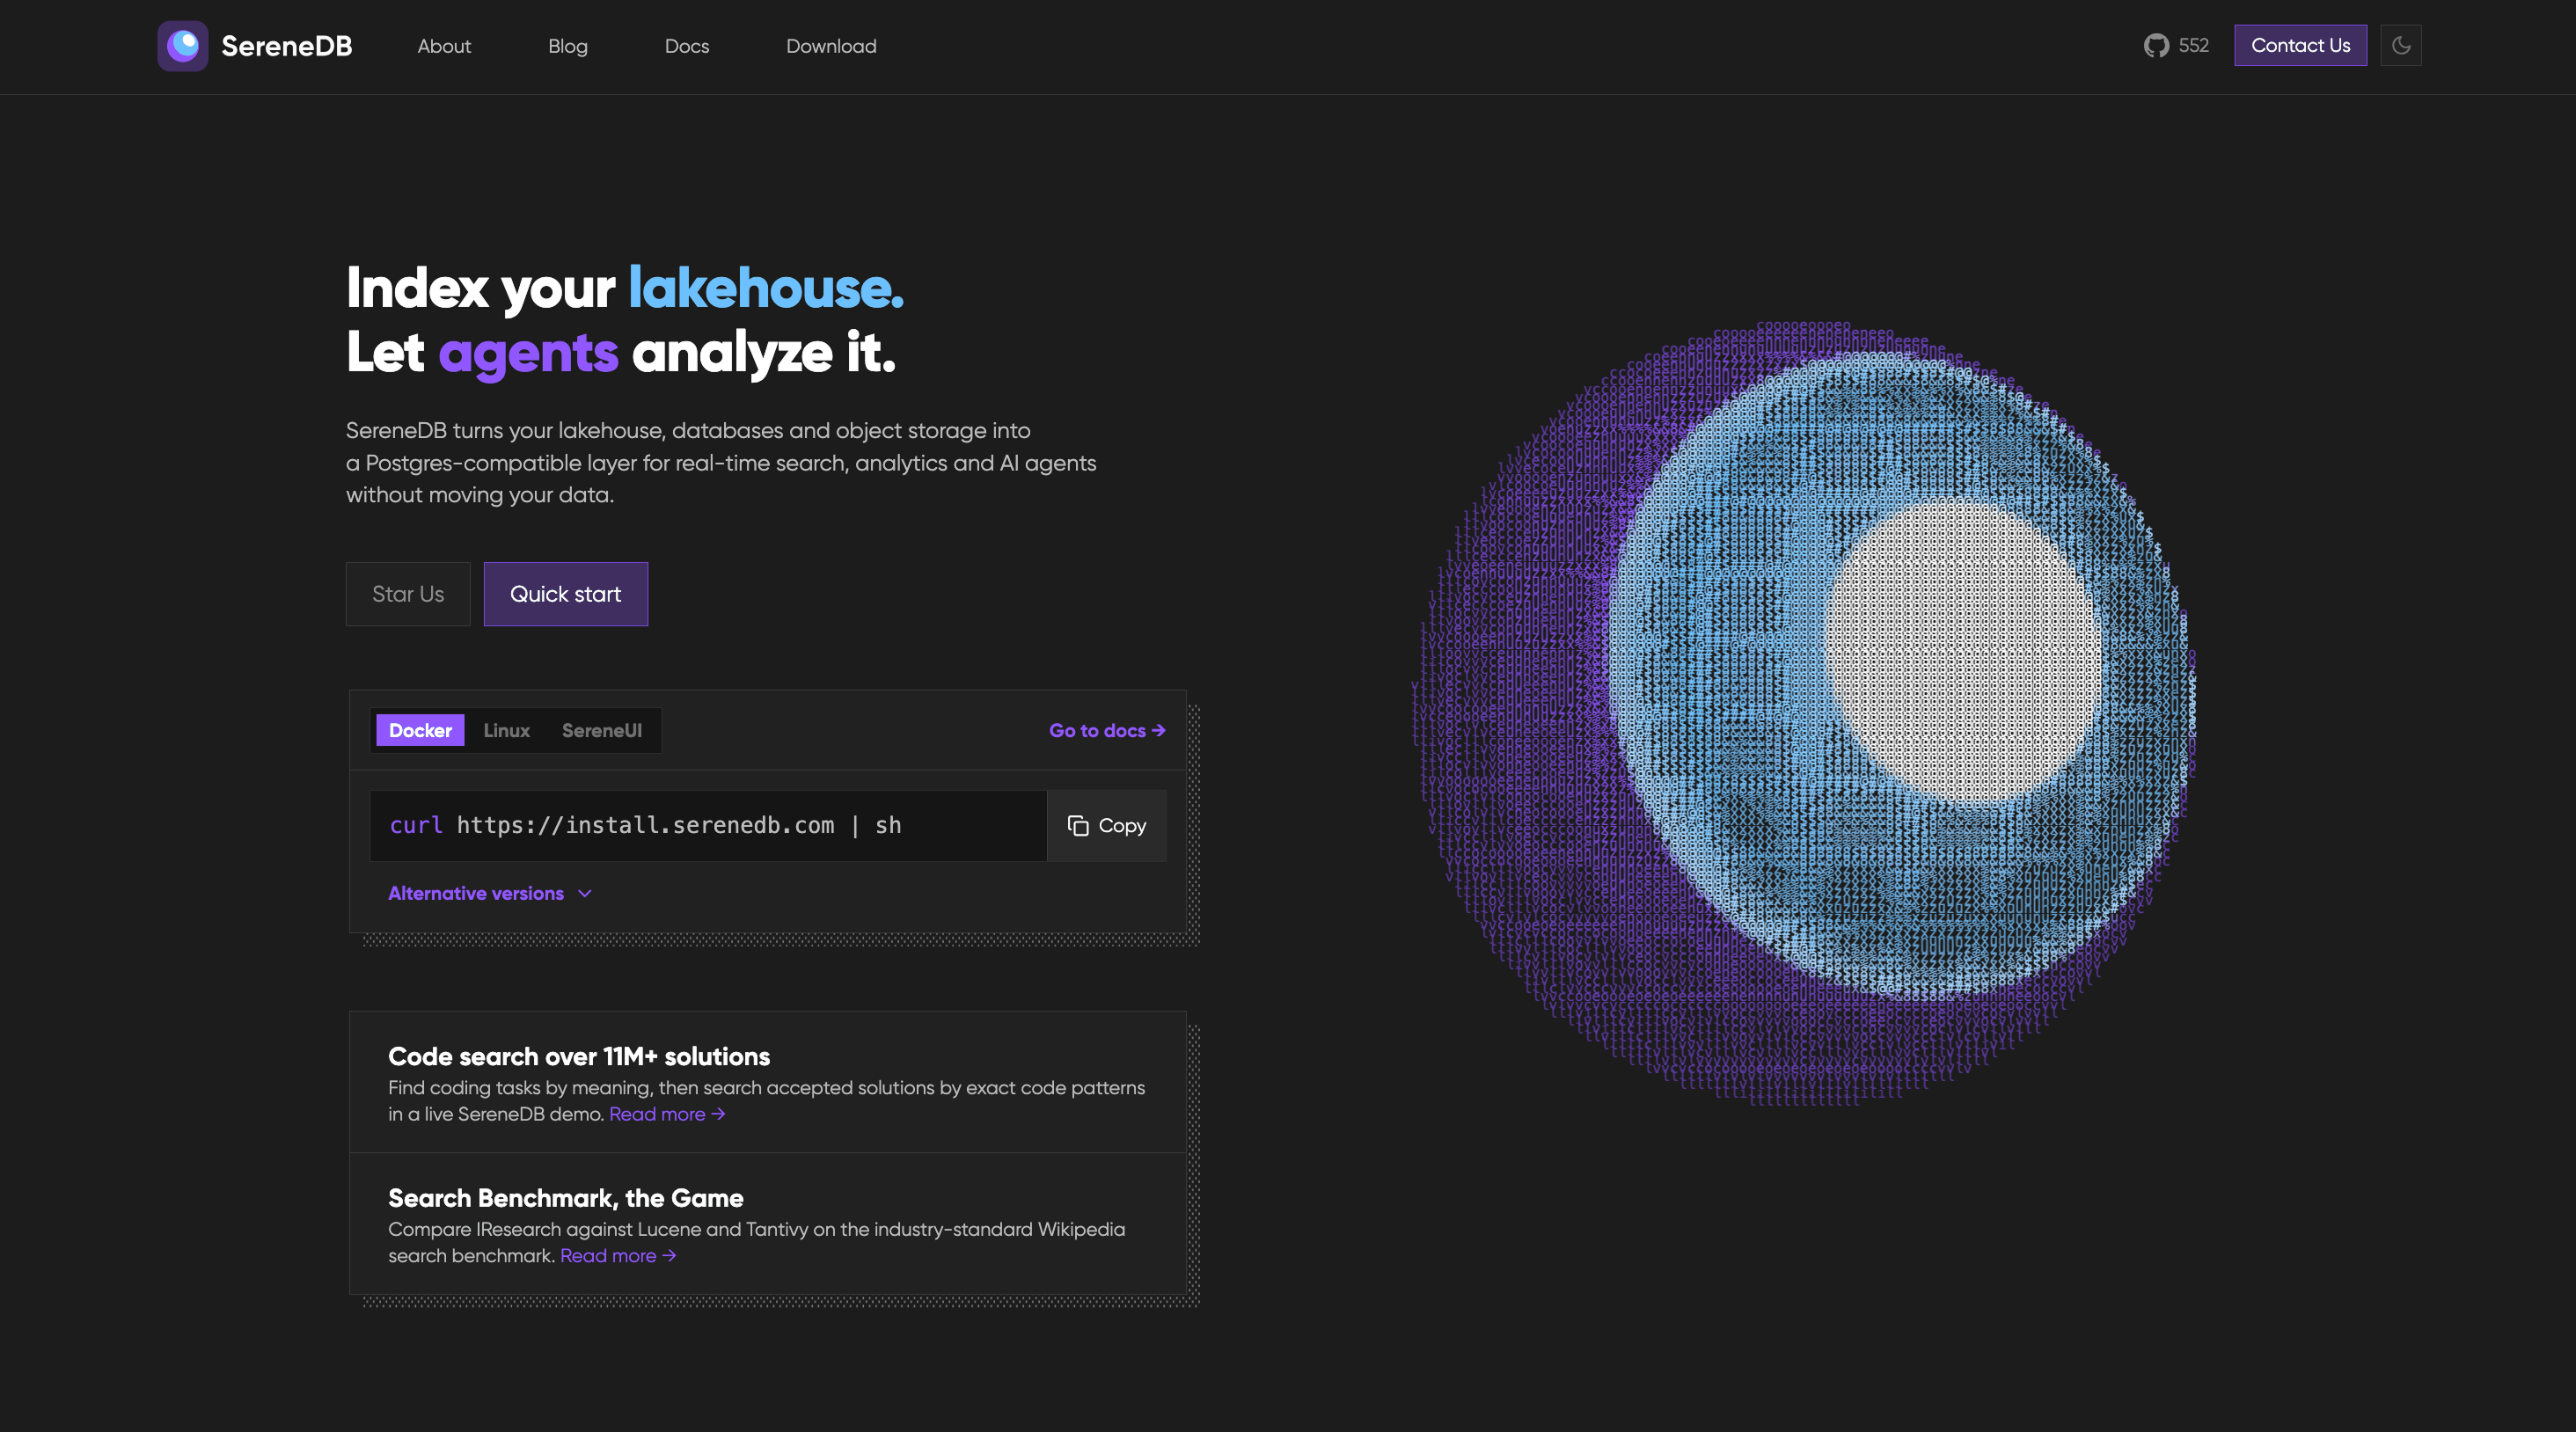
SereneDB is an open-source, real-time search analytics database that combines ultra-fast full-text search and fast analytics in a single engine. It is built for teams that need to search and analyze large volumes of data — such as logs, tables, files, and object storage — without running separate systems for search and analytics. The product offers a PostgreSQL-compatible frontend, so users can keep their existing SQL, drivers, and Elastic clients while working with full-text, vector, and hybrid search alongside relational data. According to the product's own description, it is the result of 12 years of development and is released under the Apache 2.0 license. The stated positioning is straightforward: one database that does ultra-fast full-text search and fast analytics in one engine, aimed at teams who would otherwise operate two systems. Traditionally, teams that need both search and analytics run two separate systems — for example, a search engine such as Elasticsearch alongside an analytical database such as ClickHouse — and move data between them with ETL pipelines. SereneDB's stated purpose is to remove that second system and the ETL between them by doing ultra-fast full-text search and fast analytics in one engine. The Product Hunt description says the company's public benchmark shows it outperforming Elasticsearch, ClickHouse, and Postgres search extensions, and indexing 1 billion logs in under 8 minutes at roughly 10x less disk usage. Apache 2.0 licensing, methodology, and raw results are public, so teams can evaluate those claims directly rather than taking them on faith. On the search side, SereneDB offers four related capabilities. Full-text search provides BM25 ranking over both tables and files, the classic relevance-ranking approach used for keyword search. Vector search is supported through ANN (approximate nearest neighbor) indexes that sit beside relational data, so semantic similarity lookups can live in the same database as structured records. Hybrid search combines BM25 and vector scores in a single query, letting teams blend keyword relevance and semantic similarity instead of choosing one or the other. Finally, Postgres search support means teams keep their existing drivers and their SQL rather than rewriting queries for a new search system. For analytics and data, SereneDB is designed to work on fresh data rather than overnight snapshots. Real-time analytics let users aggregate fresh data with no nightly job, which matters for dashboards and monitoring that need current numbers. As an OLAP database it performs columnar scans over billions of rows, the access pattern typical of large-scale analytical queries. Search over a data lake lets users index object storage in place instead of copying it into another system. And zero-ETL search lets queries run against remote sources where they live, further reducing the need to duplicate data or build synchronization pipelines. SereneDB also positions itself for AI and agent workloads. It is described as a database for AI agents, offering agent-ready SQL over every source, so agents can query data through SQL rather than through bespoke connectors. As a RAG database, it acts as the retrieval layer for grounded answers, supplying the context an AI application needs. Documentation search lets teams search over docs and knowledge bases, and the company's own blog describes how documentation content can be turned into tools for agents. Architecturally, SereneDB unifies search and analytics with a columnar engine, vectorized SQL execution, and hybrid storage behind a PostgreSQL-compatible frontend. That combination is what allows full-text, vector, and hybrid search to run next to analytical queries inside one engine. Compatibility is central to the approach: the database is Postgres- and Elastic-compatible, so teams keep their SQL, their drivers, and their Elastic clients. Installation is presented as straightforward — the quick-start command is a curl script — and the site lists Docker, Linux, and SereneUI as options, with documentation covering quick start, indexes, query syntax, statements, and clients. The stated benefits follow from that single-engine design. Teams can drop a second system and the ETL between it and their primary database, which simplifies the architecture and removes a class of data-synchronization problems. Because compatibility is preserved, there is no rewrite: existing SQL, drivers, and Elastic clients continue to work. The performance claims are significant — outperforming Elasticsearch, ClickHouse, and Postgres search extensions in the company's public benchmark, indexing 1 billion logs in under 8 minutes, and using roughly 10x less disk — which, if it holds for a given workload, translates into faster indexing and lower storage cost. Apache 2.0 licensing, together with public methodology and raw results, gives teams a way to verify the claims before committing. Aggregating fresh data without nightly jobs also means analytics reflect the current state rather than yesterday's snapshot. Concrete scenarios described by the product include both search workloads and analytics workloads over very large datasets. The company's published comparisons run 92 search and analytics queries over 100M, 1B, and 10B OpenTelemetry logs on a single instance, both against ClickHouse and against the Lucene world (Elasticsearch, OpenSearch, CrateDB) — clearly a log search-and-analytics scenario. Other described scenarios include building retrieval layers for RAG pipelines where an AI application needs grounded context; powering documentation and knowledge base search that can also be exposed to agents as tools; running real-time analytics on fresh data without waiting for a nightly batch job; searching over a data lake by indexing object storage in place; and querying remote data sources where they live instead of copying them first. SereneDB targets developers, data engineers, and platform teams who operate search and analytical infrastructure, as well as teams building AI agents that need SQL access to data. Integrations mentioned in the content include PostgreSQL drivers and Elastic clients, plus a documented LangChain integration for RAG. Because the database is Postgres- and Elastic-compatible, existing client libraries continue to work. The site lists Docker, Linux, and SereneUI as installation options, the quick start is a single curl command, and the documentation covers quick start, indexes, query syntax, statements, and clients. The project is open source under the Apache 2.0 license, with a public GitHub repository listed at 806 stars and public benchmarks; no commercial pricing plans are stated in the provided content. SereneDB's primary value proposition is consolidation: one database that performs ultra-fast full-text and vector search together with fast, real-time analytics behind a PostgreSQL-compatible frontend, so teams can eliminate a second system and the ETL between them. It is open source under Apache 2.0, and its benchmark methodology and raw results are public.
Anomalo Analyst is a team of AI agents that monitor your data around the clock and give you insights on anything that is happening in the data and why it matters. According to Anomalo, you connect your data warehouse or data lake and start getting data insights without writing SQL queries or refreshing dashboards. The product is built for data teams and for the people who depend on them: instead of asking analysts to hunt for what changed, Anomalo Analyst proactively publishes a continuous feed of trends, anomalies, and shifts, then lets anyone dig deeper with plain-language follow-up questions. Its stated purpose is captured in the product's own framing — your data is always talking, and Anomalo Analyst makes sure you do not miss what it is saying. Data changes constantly, and the volume of that change is the problem Anomalo Analyst addresses. In most organizations the burden falls on people to notice what moved: someone has to write a query, wait on a dashboard to refresh, or file a ticket with a data team and wait for an answer. Anomalo's messaging is explicit that most AI tools ask you to find the insight, while Anomalo Analyst finds it for you. The traditional approach means meaningful business changes can go unnoticed until someone happens to ask the right question, and raw alerts from monitoring systems often add noise rather than clarity — an alert is not the same thing as an explanation of what happened and why it matters. Anomalo also says the product helps distinguish real business changes from broken data, because a genuine shift and a data problem can look identical until someone checks. Detection starts with statistical modeling rather than LLMs. Anomalo states that its statistical modeling, not LLMs, scans every table for meaningful changes such as new values that appeared, trends that reversed, or drift that occurred, and more, then ranks every change with a magnitude score. That ranking gives the AI agent a prioritized list of real changes rather than an undifferentiated pile of events. Because the scanning is statistical and automated, it runs across every table rather than only the handful of metrics someone remembered to instrument, and the magnitude score lets the system separate small fluctuations from changes large enough to be worth a person's attention. Once changes are ranked, a team of specialized AI agents takes over: they monitor the data, detect what has changed, decide what matters, and write up the finding in an analyst-grade report, so what reaches you is a polished insight rather than a raw alert. The AI agent investigates the ranked changes, digs into historical context, and writes a report revealing what happened, what the data shows, and why it matters. A dedicated verification agent then reads every report line by line and checks each claim against the data before it reaches you — hallucinations get caught and corrected, not published. That verification step matters because the report is meant to be trusted as a written finding: Anomalo says it helps you tell a real change apart from broken data, and it checks each claim against the data rather than publishing unverified model output. Insights are proactively published to you. Anomalo describes a news feed of everything meaningful that changed in your data, delivered to your homepage and your inbox, all without prompting, plus a personalized digest of what actually changed — the trends, anomalies, and shifts that matter to your work — so you can be the most insightful person on your team without logging in. When an insight catches your eye, you dive deeper with follow-up questions and analyses in natural language instead of filing a ticket. Anomalo states the product gets smarter the more you use it: giving feedback when an insight was useful, or noting that you look at your data differently, is saved to memory, making every insight and conversation sharper. Findings can also be shared — any insight or analyst conversation can be shared with a link, and recipients can view it immediately after signing in, with no warehouse access needed. The overall flow is deliberately short. You connect your data platform and select the tables you care about; Anomalo Analyst analyzes and profiles your tables automatically and asks a few quick questions to personalize your insights; the AI agents learn from your data's history and watch your tables every day for meaningful changes; and you can dive deeper into any change or insight at any time with natural-language follow-ups. Anomalo describes onboarding as telling it what you care about, having it find the right tables and start monitoring, and going from signup to your first insight in minutes. The distinguishing methodology, in the company's own words, is that most AI tools ask you to find the insight while Anomalo Analyst finds it for you — the system does the monitoring, the prioritization, the contextual explanation, and the verification, and delivers the finished insight rather than a raw alert. Anomalo frames the benefit around being informed without effort: you show up informed, you know before anyone asks, and you can be the one with the answer. A continuous feed of trends, anomalies, and shifts arrives without writing a query, waiting on a dashboard, or filing a ticket with your data team. Because every claim in a report is verified against the data before publication, the insights you act on have been checked. And because a dedicated verification agent exists specifically to catch and correct hallucinations, the workflow is designed so the reader does not have to independently re-check the numbers in a report before using it. Concrete scenarios follow from the described workflow. A data team connects its warehouse and lets Anomalo Analyst profile and monitor the tables they care about, then reviews a continuous feed of what shifted. A person preparing for a meeting checks their personalized digest and arrives already aware of the trend that reversed or the new value that appeared. Someone who sees an insight they do not fully understand asks a follow-up question in plain language rather than opening a ticket. When an insight is relevant to a manager or teammate, it is shared as a link the recipient can open immediately after signing in — even without warehouse access. Over time, feedback on which insights were useful, and how the user looks at their data, is saved to memory so subsequent insights and conversations are sharper. Anomalo Analyst is presented for data teams and for anyone who needs to know what is happening in the data. The site says it is trusted by data teams and shows organizations including Aritzia, Atlassian, Block, Buzz, Casey's, Discover, Equifax, Evidation, Faire, Fandom, HomeToGo, Lebara, and Notion. On the data side, Anomalo describes connecting a data warehouse or data lake, and the Product Hunt listing names Snowflake, Databricks, or BigQuery. Access is via the web, and the call to action throughout is Start for Free, alongside links to request a demo to see autonomous agents in action. That is the core value proposition Anomalo Analyst reinforces at every step: your data is always talking, and a team of AI agents monitoring it around the clock means you do not miss what it is saying. Detection runs on statistical modeling, explanations arrive as analyst-grade reports with each claim verified against the data, delivery happens proactively to your feed and inbox, and investigation happens in plain language rather than in tickets. For data teams and the people around them, the outcome Anomalo promises is simple and specific: you show up informed, and you are the one with the answer.