Category Focus/categories/data-analysis
Data Analysis AI Tools
Discover and compare the best data analysis AI tools and software. Browse 70+ curated tools with reviews and rankings.
Projects tracked
70
Sort mode
RECENT
Page
1
Discover and compare the best data analysis AI tools and software. Browse 70+ curated tools with reviews and rankings.
Projects tracked
70
Sort mode
RECENT
Page
1
WorkedStats is a set of browser-based statistics calculators built around a single idea: the working should stay visible. The median calculator takes a pasted dataset and returns the median alongside the sorted list, the exact middle position for an odd count or the middle pair for an even count, and the arithmetic that produces the final number. It is designed for students, teachers and anyone who needs to show how a median was reached rather than simply report the result. The page also reports the mean, range, IQR and a box-and-whisker plot for the same data. The starting problem is a familiar one: most statistics calculators return one number. WorkedStats keeps the working visible instead — the sorted data, the formula substitution, the row-by-row deviation squares and the three quartile conventions that courses use. That distinction matters wherever the process is graded or reviewed. A homework answer of 23.5 is not worth much without the sorted line showing that positions 5 and 6 hold 22 and 25, and without the substitution (22 + 25) / 2 that turns the middle pair into the median. WorkedStats makes those intermediate artifacts part of the output, so the reasoning can be checked, copied or handed in. The median calculator runs a three-step workflow that is displayed on the page. First it sorts the data and highlights the middle. Second it picks the middle: with an odd number of values the median is the single middle value at position (n + 1) / 2 — for nine values that is the fifth one — while with an even count there is no single middle value, so the two middle numbers are added and divided by two. The page prints the position arithmetic rather than only the final number. Third it reports the result, with a copy-result action so the outcome and its supporting steps can move into another document. For a ten-value sample the page shows n = 10, the middle positions 5 and 6, the substitution (22 + 25) / 2 and a median of 23.5. Getting data in is deliberately undemanding. A dataset can be pasted with commas, spaces, tabs or as an Excel column, and blank lines and labels are ignored, so a copied gradebook column can go straight in without cleaning. Only numeric tokens are read: an empty value is not silently changed to zero, and if the count looks wrong the page suggests checking the pasted data rather than assuming a missing number was included. The dataset is stored only in the browser tab's session and is shared with the other five calculators, so the same numbers carry across the median, mean, standard deviation, average, IQR and z-score pages without retyping. Each result is accompanied by a check on the shape of the distribution. A box-and-whisker plot places Q1, the median and Q3 inside a box beside the minimum and maximum, and marks any point outside the 1.5 × IQR fences as a potential outlier. In the sample dataset the plot reads min 12, Q1 18, median 23.5, Q3 31 and max 98, with the 1.5 × IQR fence at 50.5 and 98 flagged as a potential outlier. That is how one unusually high homework score stands out without changing the median. WorkedStats is not a single page but a linked family of calculators, and each one keeps the worked-steps approach. The Mean Calculator takes a list of numbers and shows the mean with the sum, the count and every substitution in Σx / n. The Standard Deviation Calculator returns sample or population standard deviation with a row-by-row deviation table, the definition formula and the computational Σx² − n·x̄² formula, and it can copy an APA-formatted result or switch to population variance without re-pasting the data. The Average Calculator reports the arithmetic mean line by line and compares it with the median so that a skew does not fool the reader. The Interquartile Range calculator compares Q1, Q2, Q3 and IQR under the TI-83/84 and AP Statistics exclusive rule, Tukey's inclusive hinges and Excel's QUARTILE.INC interpolation, and shows the 1.5 × IQR fences, potential outliers and a live box plot. The Z-Score Calculator turns an x value, a mean μ and a standard deviation σ into a z-score and a left-tail, right-tail or two-tailed probability, or standardizes every value in the dataset at once, with the standard normal curve filling the same area that the table reports. A live preview on the median page shows the current dataset's results for all five companion tools. Two design decisions shape how the product behaves. The first is that everything runs in the browser tab: there is no upload endpoint on the page, and parsing, sorting and SVG drawing all happen in JavaScript in the tab, with the dataset kept in sessionStorage only so the other calculator pages can reuse it. A very large paste is limited by the browser rather than by an account or an upload quota. The second is that conventions are surfaced rather than hidden. The median page uses the TI-83/84 and AP Statistics convention for the box plot, and the IQR page sets the exclusive, Tukey hinge and linear-interpolation versions side by side, because those conventions can produce different Q1 and Q3 values. The median page is also explicit about what a median is and is not. It notes that the median is a positional statistic: it does not use the size of the other values, so it is robust to outliers but throws away information that the mean keeps. A Quick Summary card shows the median beside the mean — in the sample, a median of 23.5 against a mean of 30.4, a difference of -6.9, with one outlier at 98 pulling the mean up. Seeing both numbers side by side is often the point of a homework question, and it is a faster way to notice a skew than reading a definition. Concrete workflows follow from that. A student working through a homework set pastes a list of values once, reads the sorted line and position arithmetic for the median, then moves to the mean and standard deviation pages with the same dataset intact, copying APA-formatted results as needed. A teacher checking a copied gradebook column can paste it directly — labels and blank lines are ignored — and use the box plot to spot an unusually high score without that score distorting the median. Someone comparing quartile conventions can open the IQR page and see the exclusive, Tukey hinge and Excel interpolation results for the same numbers, alongside the fences that decide which points count as outliers. The audience is students and instructors in statistics courses, particularly those working with TI-83/84 calculators or AP Statistics conventions, along with anyone who needs a defensible, step-by-step statistic from a pasted list. The tools require no account and no upload, and the interface is a web page. The underlying stack is plain JavaScript running client-side, SVG for the box-and-whisker drawing, and sessionStorage for carrying a dataset between calculator pages; no chart library is used. WorkedStats treats a statistics answer as something to be demonstrated, not just produced. By pairing each result with its sorted data, position arithmetic, formula substitution and a distribution plot, it turns a single number into a checkable piece of work — and does so entirely inside the browser tab, with no upload, no account and no chart library.
MPC Unity is a web product that places real mining assets in the language of global capital markets and makes mining information verifiable on chain. It connects real mining projects with structured data, professional verification, and digital registries, positioning itself as a trust layer for mining information. The site describes the product as being in the design and build stage. Users join Unity by connecting a wallet, verifying the community and their email, and receiving a Unity certificate; the mine opens behind that certificate. From there, the experience includes quests, Crew, digs in My Mine, refining and registering ore, invitations, and weekly standings. Everything a user does writes a record under their own wallet. The background context presented by MPC Unity is a need for trusted mining information. The product frames real mining assets as something that should be expressed in the language of global capital markets while remaining verifiable on chain. Its stated role is to be the trust layer for mining information by combining structured data, professional verification, and digital registries. That matters because the content repeatedly emphasizes verifiability and records that live on chain under the user’s wallet. The FAQ states that records cannot be edited afterwards, including by the product team. The product also states that it is not an investment solicitation or offering and is for institutional review purposes only. These statements define the context: MPC Unity is presented as a way to organize and verify mining information rather than as an investment offer. One core feature group is wallet-based entry and the Unity certificate. The first step is to join and take the certificate. A user connects a wallet, verifies the community and email, and then the Unity certificate is minted to them. The mine opens behind the certificate. The FAQ explains that a wallet is the account here, so users can connect the one they already use or install one and come back. It also states that MPC never sees or holds keys. Telegram is used as a community membership check: the community group is where the project answers questions, and the check that the user joined it is what one of the join steps reads. The FAQ says it is a membership check and nothing is posted for the user. This group of features establishes identity and access around a wallet, a community check, an email, and a certificate. A second feature group is quests and Crew. Quests pay Crew, which is described as the balance the mine runs on. The whitepaper check-in comes round once a day. The website also points to a related MPC site for community check-in, where users can record daily participation. That related site is separate, currently has no rewards, and opBNB BNB gas fees apply. Crew is therefore tied to quest completion and daily check-in activity. The FAQ says users get Crew from quests, ore and goods from the mine, and a place in the weekly standings. This feature group gives users a way to earn the balance needed for mining activity and to maintain daily participation through a check-in flow. A third feature group is digging in My Mine and writing records. A dig spends 3 Crew and writes a record. A day allows up to 20 digs, and the record is what the standings read. This means the act of digging is not only a way to spend Crew; it also produces the record used for standings. The content emphasizes that everything a user does writes a record under their own wallet. The FAQ reinforces that records live on chain under the wallet and cannot be edited afterwards, by the product team either. Digging therefore connects activity, record creation, and weekly standings in one loop. The explicit limit of 20 digs per day and the cost of 3 Crew per dig define how the activity is constrained. A fourth feature group is refining and registering ore. Five of one grade fuse into one of the next grade. A registered ore pays credit over 15 days. This is a separate progression from digging: ore can be refined by combining five units of one grade into one unit of the next grade, and registration is tied to a credit that pays over 15 days. The content does not define the credit further, but it does state the 15-day period and the registration outcome. This feature group adds a transformation step and a registration step after ore is obtained, giving users a way to work with ore beyond the initial dig. The FAQ also mentions ore and goods from the mine as part of what users get. A fifth feature group is inviting partners and climbing through Ventures. When an invited partner completes the entry exam, the inviter earns 10 Crew and the partner receives 30 Crew once. The reward is claimed in Ventures. Active partners also improve the inviter’s mining bonuses. This feature group links invitations to an entry exam, one-time Crew rewards, a claim location called Ventures, and mining bonuses tied to active partners. The content states the exact Crew amounts and the one-time nature of the partner reward. It also connects partner activity to mining bonuses, which gives invitations a role beyond the initial reward. The product’s overall approach is built around a five-step run. The steps are: join and take the certificate; clear quests to earn Crew; dig; refine and register; invite and climb. The page says that is the whole run and that five steps are involved, with the first one taking a couple of minutes. Records are written on chain under the user’s wallet. The FAQ explains a relayed path: the relayed path sends records for the user, so the user pays no gas on it. Sending a record from the user’s own wallet is also offered, and that path pays its own gas. This is the unique operational model described: a wallet-based account, a certificate-gated mine, quests that pay Crew, digs that spend Crew and write records, refining and registration, invitations through Ventures, and a choice between a relayed record path and a self-sent record path. The benefits and outcomes stated in the content are concrete and activity-based. Users get Crew from quests, ore and goods from the mine, and a place in the weekly standings. Everything they do writes a record under their own wallet. The Unity certificate is minted to them and the mine opens behind it. A registered ore pays credit over 15 days. Invited partners can receive 30 Crew once, and inviters can earn 10 Crew when a partner completes the entry exam, with active partners improving mining bonuses. The FAQ says the relayed path means no gas is paid on it by the user, while the self-send path pays its own gas. The content does not promise financial returns, and it explicitly states that the product is not an investment solicitation or offering and is for institutional review purposes only. Concrete use cases follow directly from the described steps. A new user can connect a wallet, verify the community and email, and receive the Unity certificate so the mine opens. A participant can complete quests to earn Crew and use the daily whitepaper check-in. A user can record daily participation on the related MPC community check-in site, noting that it is a separate site with no rewards currently and that opBNB BNB gas fees apply. A user can spend 3 Crew per dig, perform up to 20 digs in a day, and rely on the resulting record for weekly standings. A user can refine five ore of one grade into one of the next grade and register ore for credit over 15 days. A user can invite a partner who completes the entry exam, claim 10 Crew in Ventures, and see the partner receive 30 Crew once. A user can also choose the relayed path to send records without paying gas on it, or send a record from their own wallet and pay that path’s gas. The target users, integrations, and technical details are described in specific terms. The product is web-based at app.globalmpc.tech, with a related MPC site for community check-in. A wallet is required as the account, and users can connect an existing wallet or install one and return. The join flow checks community membership and email, and Telegram is used as a membership check. Records live on chain under the user’s wallet. The content mentions opBNB BNB gas fees for the related check-in site, and it mentions Google Analytics as optional analytics that sends visit data to Google and uses analytics cookies, with first-party audience measurement when enabled. The page states that wallet, account, email, and registration details are not sent to Google and that rejecting analytics does not affect any product feature. The content does not state pricing. It also states that the product is in the design and build stage and is for institutional review purposes only. In summary, MPC Unity’s primary value proposition is mining RWA, on chain, with real mining assets expressed in the language of global capital markets and made verifiable on chain. It combines structured data, professional verification, and digital registries as a trust layer for mining information. Users join with a wallet, receive a Unity certificate, earn Crew through quests and check-ins, dig in My Mine, refine and register ore, invite partners through Ventures, and build on-chain records under their own wallet. The product is presented as being in the design and build stage, not as an investment solicitation or offering, and for institutional review purposes only.
Clutch is an NBA player prop terminal delivered as a web application. It presents every game of the day alongside the opening Pinnacle line for each player prop, season and last-10 hit rates, injury reports and game context. The product describes itself as a way to read the NBA market in numbers: every day Clutch collects opening lines, game-by-game history, injuries and the context of every game, and it states that it shows verifiable data only. Clutch is explicit that it is a data tool rather than a prediction service, repeating that there are no picks, no betting advice and no sportsbook links. It is built for people who want to examine the numbers behind NBA player prop markets themselves, and it offers a free account with the full terminal as well as a paid Pro tier. The product's stated design choices point to a specific problem in player prop research. Lines move, and once a line has moved the historical comparison is no longer clean — which is why Clutch saves the first Pinnacle line for every player when it is posted and never overwrites it, so that the comparison with history stays honest. A second problem is trust in percentages: Clutch shows, under every percentage, how many games it is based on, and states that hit rates are only displayed with at least five games in the sample. The site also draws a clear line around what it will not do, listing picks, betting advice and sportsbook links as things it does not provide, and disclosing that pace, balance and garbage time are estimates rather than official data. The first pillar of the terminal is lines. Clutch records the opening Pinnacle line — the first line for every player — saved when it is posted and never overwritten. Opening lines and odds are part of the free tier, and they are also part of the featured view of the day: the site lists every game of the day with its scheduled start time, from CLE @ NYK and BOS @ TOR through to GSW @ HOU, so a user can move from the slate into a specific matchup and read the number the market started from. Because the opening number is preserved rather than replaced by the current number, a user comparing a player's results against that day's line is comparing against the same number the market opened at, which is the basis for the honest historical comparison the site describes. The second pillar is history. Clutch shows every game of this season and last, with the result against that day's line, and reports hit rates over 5, 10 and 20 games, home or away, and against the same opponent. The free tier includes the season hit rate and the last-10 hit rate; the Pro tier adds game-by-game history across two seasons, head-to-head splits, last 5 and last 20 windows, home and away splits, streak data, DVP and hit rate on historical lines. The on-site hit rate table illustrates the format: a player, the game, the market, the line, the season hit rate and the sample, for example a points line of 8.5 with a 100% season hit rate across 8 games, or a rebounds line of 6.5 at 89% across 9 games. The site describes this as the share of games this season in which the player beat today's line, only with at least 5 games, and labels it descriptive data, not advice. The third pillar is context. Clutch surfaces injuries and game-level information: absences, pace, balance and garbage-time risk, plus spread, total and win probability taken from the market and updated every hour. The featured-today module shows how these are presented. Pace is expressed as a percentile of the expected total against the other 29 teams, with the fastest and slowest games of the slate called out and the slowest described as fewer expected possessions and therefore fewer chances for every market. Balance scores a game from 0 to 100, where 100 means a coin-flip game according to the market spread. Garbage time is shown as the probability of a final margin of 15 points or more, flagged as the highest risk on the slate. Injuries come from the ESPN report and are refreshed every hour. Clutch is unusually explicit about its method and sources. Lines and odds come from Pinnacle via The Odds API. Stats and box scores come from stats.nba.com and ESPN. Injuries come from the ESPN report and are updated every hour. Alongside the sources, the site publishes what it does not do — picks, betting advice, sportsbook links — and what it discloses: pace, balance and garbage time are estimates, not official data, and under every percentage the site shows how many games it is based on. That disclosure matters because two of the featured-today cards are built directly on those estimated metrics. For users who want to check the reasoning rather than take a number on faith, Clutch links to a dedicated method page that describes the approach in more detail. The practical benefit is that a user can assemble a full picture of a player prop in one place instead of stitching it together from several sources. The line, the historical results against that line, the sample size behind the percentage, the injury status and the shape of the game are all on the same screen. Because the opening line is preserved and the sample is always disclosed, the numbers can be judged on their own terms rather than taken on trust. And because Clutch does not publish picks or advice, the tool stays a research surface: it informs a decision without making one, which is exactly what the site promises when it says data only, no picks. Typical workflows follow the pillars. A user opens the slate for the day and picks a game, then reads the hit rate table to see which players beat today's line most often this season and how large the sample is. They open the player page to walk the game-by-game history against the line, and in Pro to check head-to-head, last 5 and last 20, home and away splits, streaks and DVP. Before finalising anything they check the injury report and the game context — pace for possessions, balance for how close the market expects the game to be, and garbage-time risk for the chance of a blowout. The featured-today cards let a user scan the slate for the fastest, slowest, closest and highest-risk games at a glance. Clutch is free to start. The Free plan costs $0 forever and includes a free account with the full terminal, every game of the day, opening lines and odds, season and last-10 hit rate, and injuries plus game context. Pro is sold as a Season Pass for $69, one payment valid until July 31, 2027, or $14 per month, and adds game-by-game history across two seasons, H2H, last 5 and last 20, home and away, streak, DVP and hit rate on historical lines. The product is web-based. Beyond the terminal, the Product Hunt listing also mentions free calculators and open data studies. In short, Clutch is a numbers-first NBA player prop terminal: preserved opening Pinnacle lines, game-by-game history with disclosed sample sizes, and hourly injury and game context, all presented as data only with no picks and no betting advice. The free tier covers the daily slate, and the Pro Season Pass unlocks two seasons of depth.
Winneradspy is a mobile ad creative intelligence platform built specifically for mobile app and game marketers. It tracks, scores, and explains competitor ad creatives running across Facebook, Instagram, and the Meta ad network. According to the product content, Winneradspy analyzes 20M+ competitor ad creatives across 200K+ apps, helping marketers discover proven winning ads in seconds and base strategy on real data. The platform identifies the winning and losing ad creatives of mobile apps and games, so users can search an app or developer and instantly browse its complete ad creative history, including install ads, video ads, banner ads, and more. Its stated purpose is to help teams find winning ads of mobile apps and games, understand what competitors are testing and scaling, and build better campaigns from those insights. The background context is that most ad spy tools were built for ecommerce dropshippers, while mobile app and game advertising has different needs. Winneradspy is built for mobile, where creative quality directly impacts cost per install. The content explains that when marketers need to know which mobile app ads are driving downloads right now, generic ad libraries do not cut it; they need a tool that speaks mobile. Manual competitor research through ad libraries is also slow and fragmented. Winneradspy positions itself as a mobile-focused alternative that goes beyond simply showing ads. It scores creatives and explains why they work, turning raw ad data into actionable creative intelligence. This matters because app marketers need to move from research to action faster, focus on creatives that are already proving themselves, and understand the patterns behind winning mobile ads rather than browsing generic inspiration. The Creative Library is a core feature. Winneradspy lets users search any app or developer and instantly browse their complete ad creative history, including install ads, video ads, banner ads, and more. The library can be filtered by platform, win rate, date, and format. This means users can see what competitors are testing, see what they keep running, and understand the pattern behind their campaigns. The usefulness is direct: instead of manually checking ad libraries and trying to remember what was seen before, a marketer can search a specific app or developer, review its creative history, and compare creatives by performance signals and format. This supports competitive research, creative briefing, and campaign planning because the user can look at actual mobile app and game ad creatives rather than generic examples. The content also describes the platform as a way to identify winning and losing ad creatives, so the library is not just a database of ads but a research surface for understanding what is working and what is not. Competitor Listening is another key capability. Users can paste any competitor's App Store or Google Play link, and Winneradspy monitors their ad activity around the clock. The platform alerts users the moment a competitor launches a new campaign, pauses a creative, or shifts their strategy. This allows users to spy on competitor ads passively, without checking anything manually. The benefit is time savings and faster awareness. Instead of repeatedly visiting competitor pages or ad libraries, a growth team or agency can receive alerts when something changes. This is especially useful for teams managing multiple mobile app clients, because competitor research can become messy when it is spread across manual checks. Competitor Listening keeps campaign changes in one place and helps users spot what competitors are testing. The content explicitly says it saves users hours every week by tracking new creatives and campaign changes without constant manual checking. Creative Scoring with the Winner Score is a distinguishing feature. Winneradspy analyzes millions of mobile app ad creatives every day and tags each one Winner or Loser with up to 99% accuracy. Every ad gets a 0–100 Winner Score that breaks down its hook, visuals, messaging, and CTA. The FAQ further states that each creative receives a 0 to 100 Winner Score based on five dimensions: hook, visuals, emotions, messaging, and CTA. This helps users understand not just whether an ad is winning, but which specific elements are driving its performance. The platform also uses a Learning tag in addition to Winner and Loser. To determine whether a competitor's mobile app ads are actively scaling or have already been dropped, Winneradspy analyzes signals including ad runtime, platform reach, creative reuse patterns, and engagement indicators. The value is that users do not just see what competitors are running; they understand why it works. This supports better creative decisions because teams can separate strong creatives from noise and focus research on ads that are already proving themselves. Winneradspy pulls ad creatives in real time from Meta Ads, Google Ads, the App Store, and Google Play, then scores each as Winner, Loser, or Learning. The platform tracks ad creatives running on Facebook, Instagram, and the wider Meta ad network, covering mobile app and mobile game campaigns worldwide. This real-time approach is important because the product content emphasizes finding what is proven in real time and what is actually working right now in a user's category and on the platforms that matter. The platform also supports querying ad insights through ChatGPT, Claude, or Gemini via MCP, according to the Product Hunt metadata. That gives users an additional way to access ad intelligence through AI tools, beyond browsing the library or receiving alerts. The combination of real-time data, scoring, and AI-accessible insights is presented as a way to move from raw ad data to actionable creative intelligence. Overall, Winneradspy works by combining a searchable creative library, competitor monitoring, AI-based creative scoring, and real-time ad data. A user can search any mobile app or game, see its advertising history, review creatives by platform, win rate, date, and format, and understand which ads are winners or losers. They can also paste a competitor's App Store or Google Play link to monitor activity and receive alerts when campaigns launch, pause, or shift. Each creative receives a Winner Score with a breakdown of hook, visuals, emotions, messaging, and CTA, so the user can understand the elements behind performance. The platform then supports the user in finding patterns, comparing competitors, and building creative briefs. The content describes this as going beyond generic ad libraries: the best ad spy tool for mobile is not the one with the biggest database, but the one that tells you what is actually working right now in your category on the platforms that matter. The benefits and outcomes stated in the content center on speed, focus, and understanding. Winneradspy helps users move from research to action much faster by finding proven creatives, comparing competitors, and spotting ideas worth testing in just a few minutes. The Winner Score helps separate strong creatives from the noise so research can focus on ads that are already proving themselves. Because Winneradspy does not just show ads but explains the hook, visuals, messaging, and CTA behind each winning creative, users get a clearer view of why an ad works. Competitor Listening saves time by tracking new creatives and campaign changes without manual checking. For agencies managing several mobile app clients, Winneradspy keeps competitor research in one place, helps spot what competitors are testing, and makes creative briefs faster to build. Users also describe it as a stronger starting point when planning a new campaign and as part of their creative research process for spotting winning patterns across mobile games. Concrete use cases from the content include searching a competitor app or developer to browse its complete ad creative history and review install ads, video ads, banner ads, and other formats. A user can filter the library by platform, win rate, date, and format to see what competitors are testing and what they keep running. Another use case is pasting a competitor's App Store or Google Play link into Competitor Listening and receiving alerts when they launch a new campaign, pause a creative, or shift strategy. Creative teams can use the Winner Score breakdown to understand which hooks, visuals, emotions, messaging, and CTAs are driving performance, then use those insights in creative briefs. Agencies can manage competitor research across multiple mobile app clients in one place. Growth teams and UA managers can query ad insights through ChatGPT, Claude, or Gemini via MCP. These workflows are all described or directly implied by the product content. Winneradspy is built for mobile app growth teams, mobile game UA managers, and performance marketers who need real competitive ad intelligence rather than generic inspiration. The content specifically addresses users running mobile app install ads who want to know exactly what is working in their market. It is also relevant to agencies managing several mobile app clients, based on the testimonial describing that workflow. The platform tracks Facebook, Instagram, and the wider Meta ad network, and it pulls creatives from Meta Ads, Google Ads, the App Store, and Google Play. The Product Hunt metadata mentions querying ad insights through ChatGPT, Claude, or Gemini via MCP. The website includes a Start for Free call to action and a Browse Creative Library action, but no detailed pricing tiers are provided in the content. In summary, Winneradspy is a mobile-focused ad creative intelligence platform that helps app and game marketers find winning ads, understand why they work, and monitor competitor activity in real time. Its combination of a searchable creative library, Competitor Listening alerts, Winner Score creative scoring, and real-time data from major ad and app platforms is designed to turn competitor ad insights into better mobile app campaigns. The core value proposition is clear: search any mobile app or game, see their winning ad creatives, understand why they work, and build better campaigns with data-backed creative intelligence.
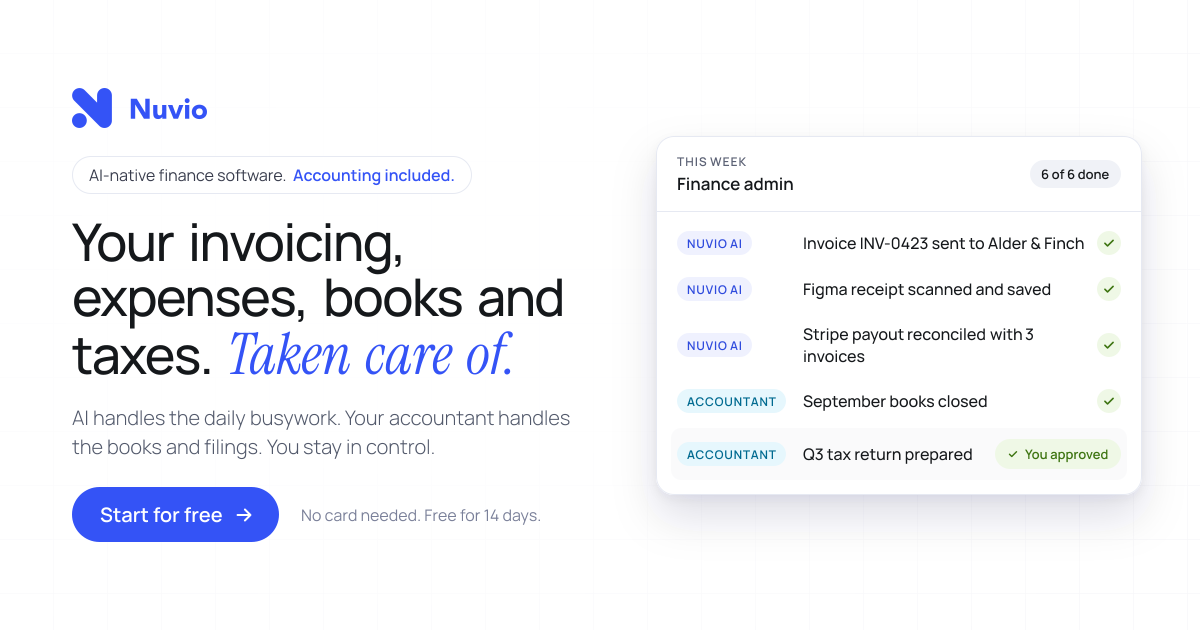
Nuvio is AI-native finance software for founders and small business owners, described on its homepage as your invoicing, expenses, books and taxes taken care of. It pairs an AI-driven workspace with accounting services: the software automates invoicing, receipt and invoice scanning, expense categorisation and bank reconciliation, while an accountant who already knows Nuvio looks after bookkeeping, year-end accounting and tax filings included in the plan. The product is positioned as one platform for finance and accounting rather than a tool you have to coordinate with a separate accountant. Nuvio states it is trusted by 1,200+ founders and small business owners and reports 60% less financial admin time on average. Users can start for free with no card needed for 14 days. The product is built around a specific problem: you started a business, not a second job managing its finances. Nuvio illustrates a founder's day broken up by finance admin interruptions, such as finding a receipt, exporting transactions or waiting for an answer, and notes that each task looks small but together they keep pulling the owner away from the business. A second coordination problem is described too: normally you have to find financial software, then find an accountant, then persuade them to work together. Nuvio aims to remove both kinds of friction by connecting the daily work, the answers and the accounting support in one place, so there is less for the owner to coordinate personally. Nuvio handles the recurring document work. You create and send invoices and track what is outstanding, and Nuvio follows up on overdue payments automatically. The site walks through an example invoice to Kestrel Labs: sent on Oct 3, past due with an alert on Oct 17, a follow-up sent by Nuvio on Oct 20, a second follow-up on Oct 27, and payment received on Oct 29. That means the owner does not have to keep every unpaid invoice in their head. On the expense side, Nuvio scans invoices and receipts and extracts the details, filling in fields such as supplier, invoice date, total amount, tax and tag, which the interface labels as AI-filled. Users review the records instead of typing them in from scratch, and expenses are categorised automatically. AI-powered reconciliation matches bank transactions with invoices and expenses, helping keep records reconciled without checking every line by hand. Nuvio shows this as a matching view in which bank transactions, including a Stripe payout, invoices from Kestrel Labs and Harbor & Pine, and an AWS expense, are paired against the corresponding invoices and expenses until all four transactions are reconciled. From there the workspace gives a running picture of the money: paid this month, outstanding, and the forecast low point, shown in the site example as $38,420 paid, $21,450 outstanding and a January forecast low of $31,200. The stated goal is that you can see what is paid, what is outstanding and where your cash is heading without assembling the picture yourself. Nuvio includes an AI finance assistant that answers questions in the user's own words rather than requiring report-building. The homepage suggests prompts such as which invoices are still unpaid, how expenses changed this month, and a request to show the cash flow forecast. In the example answer, the assistant lists four unpaid invoices totalling $21,450 with one overdue, breaks expenses down by category such as contractors, software and travel while comparing them month over month, and projects net flow and cash balance for the next four months. The same assistant can work with the user's own AI agents, so supported financial questions and tasks can be carried out from tools the user already uses; the page names ChatGPT, Claude, Grok Bot and Hermes. Accounting is included rather than sourced separately. Nuvio matches each customer with an accountant who already works in the platform, and the accountant takes care of bookkeeping, year-end accounting and tax filings as specified in the plan. Records reach the accountant's workflow directly, including invoices, categorised receipts, matched bank transactions and expenses, with no exports and no email threads. Setup follows three steps outlined on the site: connect bank accounts and bring in invoices, expenses and transactions in one sitting, with the example showing business checking, savings and company card accounts connected and 1,284 transactions imported; meet the matched accountant and confirm the accounting services included for your business; then get back to the business while Nuvio and the accountant handle the work. A weekly update summarises what was handled, such as receipts scanned, transactions reconciled, follow-ups sent and books kept up to date, and flags only what needs your decision, such as approving a tax return. The outcomes Nuvio emphasises are time and visibility. The site claims 60% less financial admin time on average and describes founders who stopped guessing and started seeing: analyses that used to take hours now take seconds, cash flow, income and expenses are viewable on a single page, financial data is visualised for readability, and users can filter and review income and expenses to take proactive action. Customers quoted include business owners, a general manager, a physiotherapist and an entrepreneur, and the page reports a 5.0 out of 5 rating from six customer reviews. The division of labour is stated plainly in three lines: the AI handles the daily busywork, the accountant handles the books and filings, and the owner stays in control. Typical use cases described on the site include sending an invoice and letting Nuvio chase it with escalating follow-ups until payment arrives; scanning or importing a supplier receipt so the supplier, date, total, tax and category are captured as an expense; letting the AI match a Stripe payout against several invoices and an AWS charge so the bank feed stays reconciled; asking in plain language which invoices are unpaid and how expenses changed month over month; checking a cash flow forecast before making a decision; and approving a prepared tax return or closing the books with the matched accountant. The product also suits owners who prefer to work from an AI agent rather than a dashboard. Nuvio is aimed at founders, owners and small business teams; the site cites 1,200+ founders and small business owners and quotes owners, general managers and practitioners at small companies. Its stated connections include bank accounts and cards for transaction import, plus AI agents such as ChatGPT, Claude, Grok Bot and Hermes. Pricing is subscription-based with accounting bundled in: users start for free with no card needed for 14 days, and the plan specifies the year-end services and tax filings included for the customer's country and business type, with that scope confirmed before subscribing. A 15-minute demo is also offered. In short, Nuvio positions itself as one place where daily financial admin is automated, financial questions get answered immediately, and the accounting and tax work is already covered by an accountant who knows the platform, so a founder can spend less time on the books and more on the business.
Alkera is an agentic data platform that brings data engineering, analysis, and science into collaborative multiplayer workspaces for humans and agents. Its open-source offering, Databench by Alkera, is described as the multiplayer workspace for data science, analytics, and engineering, where teammates and agents collaborate live inside notebooks and chats. The platform is built so that users can run any cell or agent on their laptop, another computer, or a GPU node, and can launch many agents in parallel to explore ideas. Every result traces back to the data and code behind it, so the people working in a workspace can follow a number straight to its source. Alkera is aimed at data teams that want one agentic platform to cover their entire data stack, rather than moving between disconnected tools. The context Alkera addresses is a data stack where engineering, analysis, and science are the daily work of the same team, and where agents are increasingly part of that work. Alkera's positioning is to bring those disciplines together in one place: the site promises "One agentic platform. Your entire data stack." and describes data engineering, analysis, and science happening in collaborative multiplayer workspaces for humans and agents. The promotional copy for the platform frames the outcome as "bringing confidence and speed to your agentic data stack." That combination — confidence and speed — is reflected in two of the platform's stated properties: results that trace back to the data and code behind them, and the ability to run many agents in parallel rather than one at a time. Alkera also emphasizes that it works with the applications and tools teams already use, so the platform is intended to sit alongside an existing stack instead of replacing it. Collaboration is the core of the workspace. Alkera supports multiplayer notebooks and chats in which humans and agents work side by side in the same session. The company's demo shows this directly: a user named Priya asks a signals agent to chart monthly revenue by segment for the year; the agent uses notebook tools, runs the notebook file q3-revenue.alknb.py across three cells, reports that enterprise is growing fastest at roughly 5% a month and drives most of the year's growth, and the run is marked finished. Marcus then joins the same conversation and asks to split the chart by region as well. The dbt agent responds by adding a region facet to the trend chart and editing a single cell in the same q3-revenue.alknb.py notebook. Because everyone is in the same workspace, these exchanges happen live: questions, agent actions, notebook edits, and results all appear in the same thread. Notebooks and dashboards are documented as first-class features, with a feature page dedicated to them. Agents in Alkera are not limited to a single machine or a single thread of work. The Product Hunt description states that users can run any cell or agent on their laptop, on another computer, or on a GPU node, and can launch many agents in parallel to explore ideas. That flexibility matters because different pieces of data work need very different compute: a quick chart can run locally, while a large model training run needs accelerators. The website illustrates this with a pretraining example that shows an FSDP-wrapped Llama model on 8x NVIDIA B200 hardware, with a loss curve charting training progress against tokens. In the interface, agents are presented with a model and behavior configuration: the demo shows Claude Opus selected, alongside settings labeled "High" and "Ask first," with the agent's activity counted as it uses tools (for example, "Used 2 notebook tools"). Agents also work with a charting API: the demo code calls alkera.chart(revenue).line with parameters for the x axis, the summed y value, a color split by segment, a title, a tooltip, and a facet, producing a monthly revenue by segment chart with Enterprise, Mid-market, and SMB series. Traceability is a stated property of the platform: every result traces back to the data and code behind it. Alkera extends this idea in several documented ways. Column-level lineage is shown across warehouse, transformation, and analysis layers, so a field can be followed from where it is stored, through the transformation that shapes it, to the analysis that consumes it. The platform also includes a knowledge base in which each knowledge entry shows its sources and whether it is human-verified — a visible signal of provenance for the information agents and people rely on. For changes, Alkera provides sandbox environments so modifications can be tested safely before they touch production, illustrated by a self-healing pipeline demo with a page for reviewing occurrences. Together these features give the workspace a record of where numbers come from, what depends on what, and what has been checked by a person. Alkera is organized as one platform that connects to the rest of a data stack through plugins and connections. The site states that Alkera works with the applications and tools you already use, and lists connectors spanning orchestration (Airflow), transformation (dbt), analytics databases (ClickHouse, DuckDB), lakehouse (Databricks), data warehouses (Snowflake, BigQuery, Redshift), query engines (Trino), databases (PostgreSQL, MySQL, SQLite, and generic SQL), object storage (AWS S3), data ingestion (Fivetran), business intelligence (Tableau, Looker, Sigma), data analysis (Hex), observability (Datadog), code and CI/CD (GitHub), communication (Slack), issue tracking (Linear), and knowledge sources (Google Docs, Confluence, Notion). A dedicated documentation page covers available plugins. On top of those connections, the workspace supplies notebooks, dashboards, chats, agents, knowledge entries, lineage, and sandboxes. Databench, the open-source workspace, can also be hosted by the user rather than used as a hosted service. The benefits Alkera claims are confidence and speed in an agentic data stack. Confidence comes from traceability and verification: results link back to the data and code that produced them, lineage runs down to the column level, and knowledge entries indicate their sources and whether a human has verified them. Speed comes from working with agents inside the same workspace where people already collaborate: an agent can run notebook cells, produce a chart, or edit a single cell in response to a teammate's follow-up question, and a user can fan out many agents in parallel instead of waiting on one. Running cells and agents on a laptop, another computer, or a GPU node lets teams match compute to the job, and sandbox environments let them test changes safely before they go live. All of this happens in a single workspace shared by humans and agents, so the work itself stays in one place. Several concrete scenarios appear in the material. In an analytics workflow, a user asks an agent to chart monthly revenue by segment for the year; the agent runs a .alknb.py notebook, returns the chart and a short read on growth, and a second teammate asks for a regional breakdown, which the agent adds as a facet to the same chart. In a data engineering workflow, changes are tested safely in sandbox environments before being applied, and column-level lineage shows how a field moves through warehouse, transformation, and analysis, which supports understanding impact. In an engineering and research workflow, a pretraining run is executed on 8x NVIDIA B200 GPUs with a loss curve tracking progress against tokens, using code and a run display that appear alongside the rest of the workspace. In a knowledge workflow, entries capture information with their sources and human verification status. Across all of them, the same thread of notebooks, chats, and agent actions carries the work forward. Alkera is built for data teams: data scientists, analysts, and data engineers, plus the agents that work alongside them. Its connector list indicates the surrounding stack such teams already use, from Airflow and dbt to Snowflake, BigQuery, Databricks, Tableau, Looker, and Slack. The public materials mention a generous free tier and a "Start for free" call to action, along with the option to book a demo with the founders. Databench, the open-source workspace, is available on GitHub for self-hosting. Alkera also publishes documentation for its foundations and plugins, provides security, privacy policy, and terms of service pages, and can be contacted at contact@alkera.ai. Because the open-source workspace and the hosted platform are described together, teams can choose to adopt the hosted experience or run the workspace themselves. Alkera's primary value proposition is a single agentic platform for the whole data stack: data engineering, analysis, and science performed in collaborative multiplayer workspaces where humans and agents work together. It combines parallel agent execution, flexible compute from laptop to GPU node, full traceability from result back to data and code, column-level lineage, verified knowledge entries, and safe sandbox testing, while connecting to the tools teams already use. For data teams that want to move quickly with agents without losing confidence in what those agents produce, Alkera is designed to keep the work — and the evidence behind it — in one shared place.
Pheebs is an open-source AI telemetry tool created by Eversynced that measures how engineers and teams actually work with AI coding agents. It sits quietly inside Claude Code, Cursor, and Codex via hooks, capturing lightweight interaction signals: the shape of the session, not its contents. The people it is built for are the ones who need an honest proficiency read rather than a guess — engineering leaders, platform teams, and the developers themselves. Its purpose is measurement: turning the ordinary activity of agent sessions into signals about model choice, verification habits, context management, orchestration, and the dollars that model choices are costing. The problem Pheebs addresses is a visibility gap that opens up precisely when a team starts moving fast. AI coding agents arrive, adoption climbs, and nobody can say what changed. Six observations illustrate the questions the tool was built to answer: model spend that buys nothing, such as a bigger model than the work needed; where AI code ships unchallenged; whether AI output gets verified at all; rework hiding inside the speedup, where follow-up prompts are fixing something the AI broke; and whether the enablement investment landed — for example, a review skill used weekly by 78% of engineers while a migration skill never caught on. The final observation frames the stakes: nobody on the team runs tests inside the agent loop, which is a missing harness rather than a skills gap. Distinguishing a structural gap from a coaching gap is the core problem Pheebs exists to solve. Pheebs captures data by hooking into the agents themselves. It works with three coding agents — Claude Code, Cursor, and Codex — and records seventeen event types that run from session_started through to artifact_found. Hooks fire on session starts and ends, prompt submissions, skill and slash-command expansions, sub-agent spawns, tool calls and failures, compaction, and background tasks. Typical recorded fields are deliberately small: a session_started event carries a codebase such as acme/checkout and a model such as opus; a prompt_submitted event carries a character count and, when the prompt intent classifier is enabled, an intent label such as task or debug; a tool_use_completed event carries the tool name and its duration, with recognized commands summarized as a tool_intent such as test_run. Claude Code and Codex additionally export native OpenTelemetry metrics and logs through the Pheebs proxy, while Cursor is covered by hooks alone. The design constraint behind all of this is that Pheebs captures interaction patterns, not content. It never records source code or file contents. It never records file paths or directory structures — a repo is reduced to org/repo from the git remote. It never records prompt text; a prompt becomes a character count. It never records raw command strings, since a command like npm test is read in process and recorded as tool_intent: test_run. It never stores your name or your email: the developer is the id behind your Pheebs token, stamped by the backend, or a truncated hash of your git email when no token is set, and your GitHub handle is never looked up. The only route in the backend contract that receives raw text at all is POST /classify-prompt, which takes one prompt in and returns one label out. The backend contract also includes POST /ingest for one event envelope per request, POST /validate-token to resolve a token to an identity and its consent flags, POST /otel/v1/{signal} as an OTLP passthrough so no observability credential ever ships in the client, and an optional GET /insights for what one developer can see about their own work. On top of those signals sits a documented proficiency model. It assesses six competencies: Models, covering model choice, effort settings, plan mode, and autonomy modes; Artifacts, the reusable configuration that shapes the agent, such as skills, sub-agents, slash commands, and context files; MCP, live connections to external systems like tickets, databases, browsers, and documentation; Evals, verification wired into the agent loop through tests, typecheck, lint, build, and review passes; Context management, deliberate use of the context window including compaction and the save, resume, clear lifecycle; and Orchestration, running more than one agent at a time via sub-agents, parallel work, worktrees, hooks, and plugins. Each practice is classified as Unobserved, Adopted, or Recurring — Recurring meaning it showed up in at least 3 of the last 4 active weeks — and the coverage index summarizes, per engineer, the share of applicable practices at Recurring. Five judgement signals sit alongside the competency model. On the output side, verification coverage measures the share of AI edits followed by a verification action such as a test run, typecheck, lint, build, or a check against a spec; pushback rate measures how often the engineer challenges AI output instead of accepting it; the refinement-to-repair ratio separates follow-up prompts that refine intent from those that repair breakage; and wholesale-accept rate captures sessions with no pushback, no repair, and no verification, weighted by lines changed — described as the composite red flag of polished output with no questions asked. On the input side, model-fit rate measures the share of sessions whose model class matched the size of the work. Pheebs follows three stated principles here: tasks are sized, so every task prompt gets a scope from a one-file change to open-ended design and a session is judged on its hardest prompt; misses count both ways, because an over-provisioned session burns budget silently while an under-powered one shows up as repair prompts; and Pheebs is an audit, not a router — it never intercepts a prompt or switches a model on anyone's behalf, it reads the gap and prices it, and the decision stays yours. The overall pipeline has five steps. A hook fires. Lightweight fields are extracted — event type, durations, counts, models, trigger types — with prompt text reduced to a character count and an optional intent label. Identity and repo are resolved from the Pheebs token or a truncated git email hash, and from org/repo on the git remote. Every event is logged locally in a JSONL log, and with a token set it is also sent to the backend. OpenTelemetry rides along for Claude Code and Codex. Sending requires both settings to be present: pheebs config set base-url and pheebs config set token. Both need to be set or nothing is posted, and unsetting either one stops sending — the local JSONL stays the durable copy either way. Pheebs also states there are four routes to any backend: self-hosted, or managed by Eversynced. Two deployment shapes are described. In the self-hosted model you run the backend and hold the data: telemetry goes from developers' machines to your infrastructure and Eversynced never sees it. That option includes the full client for all three agents under Apache-2.0, a documented contract and a reference backend in the repo, raw JSONL you can query with whatever you already use, and no account, no key, and no requests. In the managed model, the same open-source client points at a backend Eversynced operates, with the proficiency model rendered as reports and dashboards — the AI Enablement Assessment, a 30-day telemetry sprint ending in an executive debrief and a plan for the gaps. The benefits the content states are visibility rather than surveillance: knowing which models are in play, whether AI output gets verified, whether enablement investments landed, and what the model-fit gap costs. The reporting built on top includes a practice adoption funnel, with one bar per competency split by how many engineers have not acted on it, acted on it once, or acted on it week after week; a practice heatmap putting every engineer against every competency, where a cold column means the team is missing the setup and practice for it and a cold row calls for coaching; a per-engineer view showing how much of each competency has become habit; and a signals table showing the five judgement signals per engineer against a team median. The dollar view prices the gap: in the illustrative example, a savings opportunity of $9,960 against $32,400 of list-price spend, described as 31% and an API list-price equivalent estimated upper bound, with models used and work as sized split across Frontier, Large, Medium, and Small classes. Decisions and figures come from complete sessions only, with coverage reported as complete, incomplete, no telemetry, and unpriced. The quickstart is three commands: npm install -g pheebs, pheebs init for interactive setup across all three agents, and pheebs doctor to check the wiring. Eversynced states that every Eversynced engineer is instrumented with Pheebs; it powers the measurement layer of their AI delivery framework, and the reporting built on top of it ships with the AI Enablement Assessment run for client teams. The product is therefore aimed at teams adopting AI coding agents who want evidence about how those agents are actually being used in their codebase. In short, Pheebs turns the day-to-day shape of AI coding sessions — model choices, prompts reduced to counts, tool calls, verification, compaction, and orchestration — into an honest, legible read on proficiency, adoption, and cost, while keeping the code, the prompts, and the identity of the developer out of the dataset.
Monospace from Directus is a governed API layer positioned between enterprise data and everyone who builds on it. Its core promise is captured in two lines from the product itself: it is the governed API layer for every app, person, and agent, and it brings all your data into one space. The product lets you connect any data source, after which your developers, business teams, and AI agents receive live, read-write access to that data. Critically, this access is delivered without copying or moving any of the underlying data, so the systems of record stay exactly where they are while the people and tools that need them gain a single, governed way in. The problem Monospace addresses is rooted in legacy infrastructure. As the product explains, your oldest databases were not built with AI or modern applications in mind. Those systems hold valuable data, but they were designed for a different era of software and a different set of consumers. Exposing them to contemporary applications, to business users who want self-service access, or to AI agents that expect programmatic, read-write interaction has traditionally meant rebuilding, migrating, or duplicating those databases. Monospace avoids that entire class of work by generating interfaces directly from the databases as they are. That approach matters because it preserves existing investments in data infrastructure while unlocking the data for modern consumers. The first capability is broad connectivity. Monospace connects to any data source, which means the value of the product is not limited to a single database technology or a single vendor's ecosystem. Rather than forcing organizations to standardize or migrate before they can build on their data, Monospace meets the data where it already lives. This is useful because real enterprises run on a patchwork of systems accumulated over years or decades, and the cost of consolidating them is often prohibitive. By accepting any data source as a starting point, Monospace lowers the barrier to giving modern applications, teams, and agents access to data that would otherwise remain locked inside the systems that hold it. The second capability is live, read-write access. Once a data source is connected, the people and tools that build on it are not limited to read-only reporting or exports. Developers, business teams, and AI agents all get read-write access to the connected data. Read-write access is what makes the layer useful for real workloads rather than just observation: applications can create and update records, business teams can work with data directly, and AI agents can act on the data rather than merely describe it. The emphasis on live access reinforces that Monospace is not a snapshot or a sync engine; it reflects the state of the underlying data source as it changes. The third capability is the governance layer itself. All of these consumers — developers, business teams, and AI agents — operate under the same granular permissions model. That single model is what makes Monospace a governed API layer rather than simply an access layer. Granular permissions mean access can be scoped precisely to what each consumer needs, and because every consumer class is governed by the same model, organizations do not have to maintain separate access regimes for their human users and their automated agents. Combined with the fact that no data is copied or moved, this means governance is applied at the point of access rather than through duplicated datasets that each carry their own risk of drift, staleness, and inconsistent permissions. Monospace's distinctive approach is real-time introspection. Instead of requiring a data model to be redefined, exported, or rebuilt in a new system, Monospace generates interfaces directly from existing databases, as they are. It does this by introspecting the schema and queries in real time. In practical terms, that means the structure of the database — its tables, fields, relationships, and the queries used against it — is read by Monospace and used to produce the interface that developers, business teams, and AI agents then use. Because the introspection happens in real time, the generated interface stays aligned with the database rather than drifting from it as the schema evolves. This is the mechanism behind the product's central claim: your oldest databases do not need to be rebuilt, because Monospace generates the interface on top of them instead. The benefits follow directly from those capabilities. First, organizations avoid the cost, risk, and downtime of rebuilding legacy databases for modern applications or AI. Second, because no data is copied or moved, there is no duplicated dataset to keep in sync, and the system of record remains the single source of truth. Third, a single granular permissions model simplifies governance across every class of consumer — human and automated alike. Fourth, the combination of connecting any data source with live read-write access means the data an organization already owns becomes immediately usable by the applications, teams, and agents that need it, rather than being trapped behind a migration project. Together these outcomes turn existing, sometimes aging data infrastructure into a foundation that modern consumers can build on. Concrete scenarios follow from how the product describes itself. One is giving AI agents live, read-write access to enterprise data: rather than working from copies or stale extracts, an agent can operate against the real data under the same permissions model as everyone else. Another is enabling business teams to work directly with data that lives in systems they would otherwise need engineering help to reach, with granular permissions keeping that access appropriately scoped. A third is equipping developers to build modern applications on top of databases that were never designed for them, without a rebuild, generating interfaces straight from the existing schema and queries. A fourth is unifying access across multiple data sources: because Monospace connects any data source, organizations that run several systems can expose them through one governed layer, in one space, rather than building a separate integration for each. Monospace is explicitly built for three audiences: developers, business teams, and AI agents. The mention of enterprise data and of governance indicates the product is aimed at organizations, and it comes from Directus, an established name in data and developer tooling. Its positioning as an API layer confirms that it is consumed programmatically. The website lists no pricing tiers in the available content, and no technology stack or integration list is stated, so those details should be confirmed directly with the vendor. What is stated is the shape of the product: an API layer, governed, connecting any data source, serving developers, business teams, and agents alike. Monospace from Directus takes a clear position on a common enterprise problem: the data you already have should be usable by the apps, people, and agents of today without being rebuilt for them. By sitting between enterprise data and everyone who builds on it, connecting any data source, granting live read-write access under one granular permissions model, and generating interfaces by introspecting schemas and queries in real time — all without copying or moving data — Monospace turns existing databases into a governed foundation for modern development, self-service access, and AI. All your data. One space.
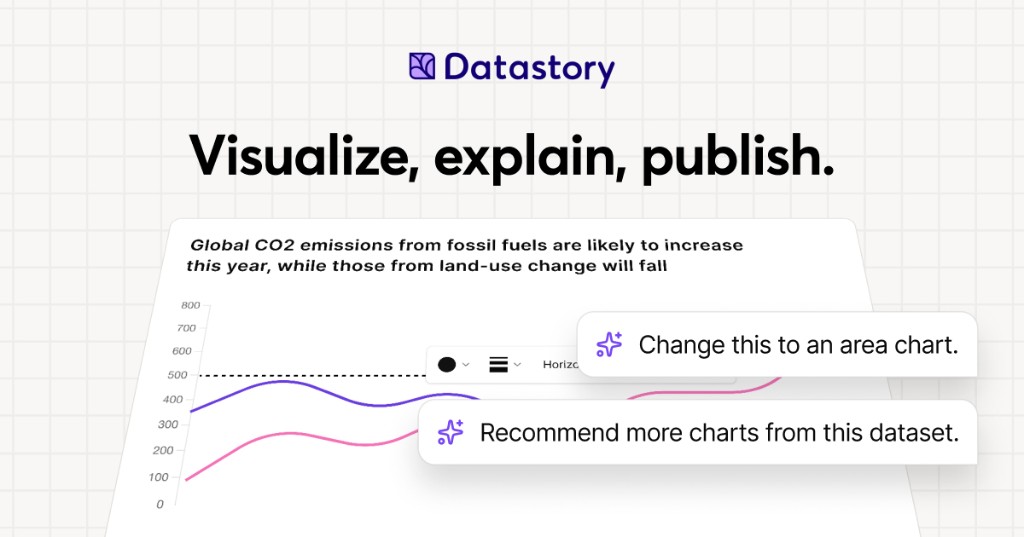
Datastory is a no-code platform for data storytellers. It is built for people who want to turn the world's data into stories worth sharing, whether that data comes from their own spreadsheets or from a curated catalog of open datasets. With Datastory you can upload your own data or search the catalog, let AI suggest the charts, and publish in minutes. The platform brings together a visualization Studio, a CMS, AI assistance, and access to more than 2,000 open datasets, so that interactive charts, websites, and reports can be created in one place. Its stated purpose is to take users from raw, messy data all the way to a published narrative, producing charts that tell a story instead of just showing stats. Datastory positions itself against the limits of conventional charting tools. Its website states that most tools stop at the visual, while Datastory does not, describing itself as the only platform that takes you from raw, messy data all the way to a published narrative. That framing reflects a common workflow problem for anyone working with data: finding trustworthy source material, understanding what the columns in a table actually represent, choosing a chart type that fits the shape of the data, writing accurate captions with sources attached, and then distributing the result in a format that works across channels. Datastory addresses each of these steps inside a single no-code environment, rather than asking users to stitch together a spreadsheet, a charting library, a design tool, and a CMS. For organizations that publish statistics, the platform is intended to close the gap between having data and communicating it clearly to an audience. The visualization layer is built around a diverse gallery of chart types with interactivity and responsive design out of the box. Datastory lists bars, lines, areas, beeswarms, slopes, treemaps, scatter plots and more, describing them as every common data visualization, ready to use. Users can switch chart types without re-binding data, so a single table can be expressed as one chart and then re-expressed as another without rebuilding the underlying dataset. The chart picker is smart: it looks at the columns in your data and proposes the right encoding, whether the data is categorical, temporal, geographic, or hierarchical, and chart-type suggestions are driven by the shape of the data itself. The stated goal is to go from table to polished data visualization in minutes: pick a table, pick a chart, ship it, or start from one of the editorial templates and tweak. Every chart is responsive and can be embedded anywhere, and users can add inline annotations, sources, and methodology, then customize to their own brand or pick from journalism presets. Datastory AI is presented as AI that actually understands your data. You can ask AI to recommend interesting angles or come with a specific question and get an answer grounded in your tables, with a chart to match. The AI ships with your CSV file, linked data, or Datastory's Open Data Catalog as context: it reads your tables, understands your dimensions, picks the right chart, and writes the caption with sources attached, while the user stays in the driver's seat. The platform emphasizes that auto-captions come as editable drafts and that AI can only provide insights grounded in data that exists in your workspace, so there are no data hallucinations and never a hallucinated stat. Compose with AI lets users build whole stories from a prompt, such as visualizing Swedish housing prices by region since 2010, and the insight finder surfaces anomalies, trend changes, and correlations across thousands of rows in seconds. More broadly, AI-powered insights are described as revealing hidden patterns, unexpected correlations, and key drivers within datasets, turning raw information into actionable intelligence. The Open Data catalog lets users find, explain, and visualize statistics from quality data sources, browsing datasets from vetted sources such as the OECD, WHO, and Eurostat. Powerful browsing by topic, source, or trending helps users find exactly what they need, and a country filter makes it easy to find data that their own country has reported on. The catalog is intended to help users quickly find reliable data for a project or to enrich an organization's own data by adding a global perspective that nuances local or industry-specific figures. Examples highlighted on the site include Women in parliament worldwide and Population trends in Europe, both from the World Bank, plus sample CSVs such as the world's largest cities ranked from Wikidata and Sweden's most common surnames from SCB. Users can also supercharge an analysis by connecting their own data with open data sources to tell a more complete story. The Datastory workflow is described as a four-step path from connection to publication. Step one is Connect data: pull data from spreadsheets, your own linked data, or quality metrics from the Open Data Catalog. Step two is Shape your story: collaborate with AI to identify the most interesting insights and the best way to visualize them. Step three is Refine details: edit captions, add annotations, and tweak colors to make the story pop, either by asking AI or by tweaking manually. Step four is Publish: release the result as a standalone link, embed it in websites, or export it as a high-quality image, ready for any channel. This sequence is the core of the platform's differentiation, since it deliberately extends past visualization into narrative creation and distribution. Publishing and distribution are handled through an anywhere-embed approach. Users can drop a chart into Notion, Webflow, a newsletter, or a CMS, using a responsive iframe with shareable URLs and OG previews baked in. Charts are responsive and can be embedded anywhere, and the final output can also be published as a standalone link or exported as a high-quality image. Because the same chart can be embedded in multiple destinations while keeping shareable URLs and preview metadata, the platform is designed for teams that need their visuals to travel across websites, documentation, and social channels without rework. The outcome Datastory emphasizes is the ability to inform, engage, and drive action with compelling visualizations. Organizations that use it describe making their work more accessible and more effective. Tax Justice Network says Datastory has more than lived up to its expectations and that the team was a delight to work with, adding that it is thrilled about the Policy Tracker Datastory developed and looks forward to sharing it publicly. AI Sweden describes Datastory as knowledgeable, flexible, and fast as a supplier, and values the creative dialogue and the ideas that made the end result better than hoped for. Swedish House of Finance says that with Datastory's help it was able to make its research accessible to a much wider audience, crediting enthusiasm for research communication and knowledgeable staff for a very successful collaboration. Concrete use cases on the site include visualizing municipality data, where Datastory built an interactive map application for AI Sweden using its advanced charting library and data management system, producing the Kommunkartan map of AI initiatives across Swedish municipalities with bar charts, filters, and zoom controls. Other described scenarios include building a policy tracker for an advocacy organization, making academic research legible to a wider audience, embedding a chart into a Notion page, Webflow site, newsletter, or CMS, and enriching an organization's internal data with open datasets to add a global perspective. The platform's sample content, such as GDP per capita rankings and population trends, illustrates how published charts are meant to be shared directly with readers. Datastory is aimed at data journalists, researchers, and analysts, a group the site names explicitly while inviting them to create compelling visualizations that inform, engage, and drive action. It is also used by larger organizations; the site lists United Nations Department of Economic and Social Affairs, AI Sweden, Tax Justice Network, the International Federation of Red Cross and Red Crescent Societies, Swedish House of Finance, Swedish Television, Dagens Nyheter, and Internet Foundation in Sweden among the organizations that trust it. Beyond the self-serve platform, Datastory Enterprise offers to design and build impactful data products with Datastory's award-winning team, covering strategy, custom applications, data integration, and training, all powered by the Datastory platform, with an invitation to contact the team for details. The summary takeaway is straightforward: Datastory is a no-code environment where open data, your own data, and grounded AI come together to produce interactive charts, websites, and reports that can be published and embedded in minutes. Its distinguishing claim is that it carries a project the full distance from messy raw data to a shareable, sourced narrative, rather than stopping at the chart.
FixMyFX is a free, no-sign-up calculator for founders who sell or spend in foreign currencies. It lets you enter your annual revenue and annual expenses, and shows roughly what FX fees are costing you per year, followed by a plain-English plan to minimise those costs. The recommended approach is to receive and spend in the same currency, for example by using Wise or Airwallex alongside a local bank account. Where most FX tools compare transfer rates, FixMyFX looks at your whole flow — both income and spending — and the tool runs entirely in your browser, so your numbers are never collected or sent to a server. The problem FixMyFX addresses is what the site calls the "Lazy Tax." Most founders get charged FX fees twice: once on income and once on expenses, which can quietly drain a meaningful share of revenue. The calculator's framing notes that most founders lose 2-5% of revenue to hidden FX fees. FixMyFX is designed for companies that sell to customers abroad, pay suppliers abroad, or both; the site states plainly that if your company, clients and suppliers are all in the same country, you probably don't need this tool. Because the loss is spread across payment processing and bank spreads rather than appearing as a single line item, it is easy to overlook until it is quantified in annual terms. The calculator itself is built around a short set of inputs. You first select where your company is registered, choosing from United Kingdom (GBP), United States (USD), Eurozone (EUR), Australia (AUD), Canada (CAD), the Nordics (DKK/NOK/SEK), New Zealand (NZD), Singapore (SGD), or Other (USD). You then describe how you manage currency: either a Single Currency setup, where you use your local bank for everything in a standard arrangement, or a Multi Currency setup, where you hold funds in multi-currency accounts in an FX-optimised arrangement. Finally you enter your annual revenue and annual expenses in your home currency, along with the percentage of each that is in a foreign currency — for example 60% of revenue or 40% of expenses, with expenses such as SaaS tools, ads and hosting paid in USD given as a typical example. FixMyFX then estimates your fees under two scenarios. The "Current setup" — labelled the Lazy Tax — combines Stripe auto-convert with bank FX. The calculator explains its assumptions inline: Stripe auto-conversion costs 1% (US) or 2% (UK/EU/Rest) on inbound foreign revenue, and a typical bank FX markup of around 3% is applied as a spread on foreign spending and subscriptions. The "FixMyFX setup," labelled Zero Leak, assumes a multi-currency account instead. Direct payout to a matching multi-currency bank account carries a 0% fee; direct spend from matching currency balances also carries a 0% fee; and only the net profit transferred home is converted, at roughly a 0.4% fee using the interbank rate. Both estimates are broken down in the interface under a "How is this calculated?" disclosure so you can see where the numbers come from. The headline output is the Potential Annual Savings, calculated over a 12-month period and framed as money that goes back into your business every year. FixMyFX translates the figure into tangible equivalents so it is easier to grasp — MacBooks Pro, months of Claude Max 20x, Claude Max 5x and Claude Pro subscriptions, and fancy coffees. There is also a toggle to include your savings amount when sharing, and one-click sharing to Twitter/X and LinkedIn, with prefilled text noting that most founders lose 2-5% of revenue to hidden FX fees. If your inputs show you are already operating efficiently, the tool shows a "You are winning!" state instead, explaining that you don't auto-convert revenue (saving 1-2%) and that paying expenses directly from foreign currency balances stops the FX leak completely; in that case it assumes you pay roughly 0.4% conversion fee only on the net profit you bring home. Beyond the number, FixMyFX provides a plain-English, four-step plan for achieving the savings. Step one is to open a multi-currency account, with Wise Business or Airwallex given as examples, matching the currencies your customers pay in (EUR/GBP/USD). Step two is to connect those local bank accounts to Stripe so payouts land directly, avoiding Stripe's 1-2% auto-conversion markup. Step three is to pay foreign expenses — SaaS, ads, overseas contractors — directly from those currency balances with zero FX spread. Step four is to convert only what is left back to your home currency at transparent ~0.4% interbank rates. The four steps are shown alongside the savings estimate and can be expanded in place. A defining characteristic of FixMyFX is that the calculation runs entirely in your browser. The site states that none of your numbers are collected, sent to a server, or tracked, and that no sign-up is required. That makes it practical to enter real revenue and expense figures without worrying about where the data goes. The tool is explicitly presented as an estimator: it provides estimates based on standard publicly available fee structures, does not constitute financial advice, and advises checking your own bank's PDS. The outcome FixMyFX is designed to produce is straightforward: stop the FX leak and keep more of your revenue. By quantifying the annual cost of auto-conversion and bank spreads, it turns an invisible overhead into a specific number you can act on. The estimated savings figure is presented as money that returns to the business each year, and the accompanying plan gives concrete steps rather than general advice. For founders already running a multi-currency setup, the tool provides confirmation that their arrangement is efficient, along with an explanation of why. Practical scenarios include a UK-registered SaaS company billing customers in USD and EUR through Stripe, which can enter its revenue mix to see what auto-conversion is costing. Another is a founder paying for SaaS tools, ads and hosting in USD while earning in GBP, who can model the bank spread on those subscriptions. Founders weighing whether to open a Wise Business or Airwallex account can use it to size the opportunity first. Teams already holding multi-currency balances can run the numbers to confirm they are winning. And founders who want to share the result can post a prefilled message to Twitter/X or LinkedIn with or without their savings amount. FixMyFX is aimed at founders of companies that sell or spend in foreign currencies — particularly those registered in the UK, US, Eurozone, Australia, Canada, the Nordics, New Zealand or Singapore, with an "Other (USD)" option for everywhere else. It is free to use, requires no sign-up, and runs on the web. It was built by Tania Bell, described as a product manager who can code and a former finance manager. The site also offers an optional way to support the builder through a "buy me a coffee" gratuity in USD, GBP or EUR at preset amounts ($5, $15, $25) or a custom amount, explicitly framed as a non-refundable voluntary gratuity rather than a purchase of goods or services. In short, FixMyFX is a free browser-based calculator that shows founders what foreign exchange fees are costing them across both income and expenses, then hands them a clear four-step plan — open matching multi-currency accounts, connect them to Stripe, pay foreign bills directly, and convert only the remainder — to keep that money in the business instead. It is a diagnostic and an action plan on one page, with no sign-up and no data leaving your browser.